10Y at 4.78%: The Last Time Yields Traded This High
Last time 10Y rejected 4.80% and QQQ squeezed 8% in a month — now oil, yields, and breadth stack into a priced-in rate hike and an Anthropic IPO
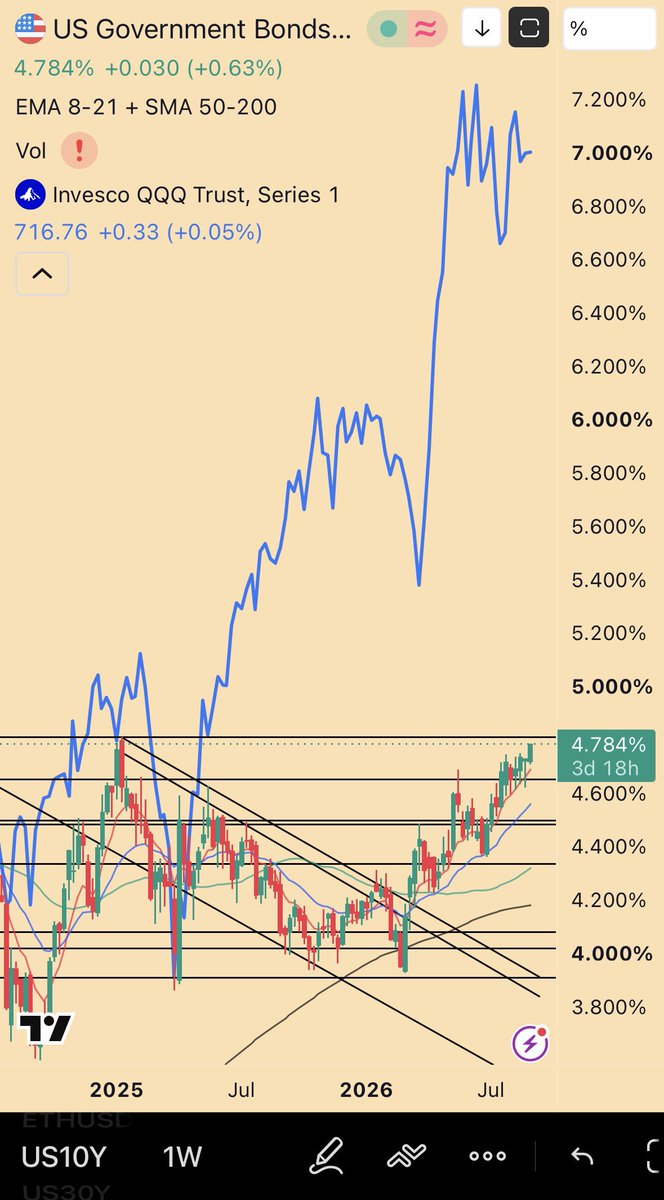
US 10Y at 4.784% (+0.63%) — back at the 4.80% rejection zone, QQQ (716.76) in the overlay
Mandelbrot closed Monday night reminiscing: the last time the 10Y traded this high, it rejected 4.80% — and the Nasdaq proceeded to squeeze up 8% over the next month. This time there is "lots of doom on the timeline (outside of crypto)", and rightly so: oil, yields, and breadth all rolling into a 2/3s priced-in rate hike, followed by an Anthropic IPO that will draw on already diminishing liquidity. "It's one of those situations it's really hard to have any great bull ideas — I can see it. Not really a 'market call', but this is a reminder to understand the realm of possibilities here."
Hunter's Miner Targets, Amplified
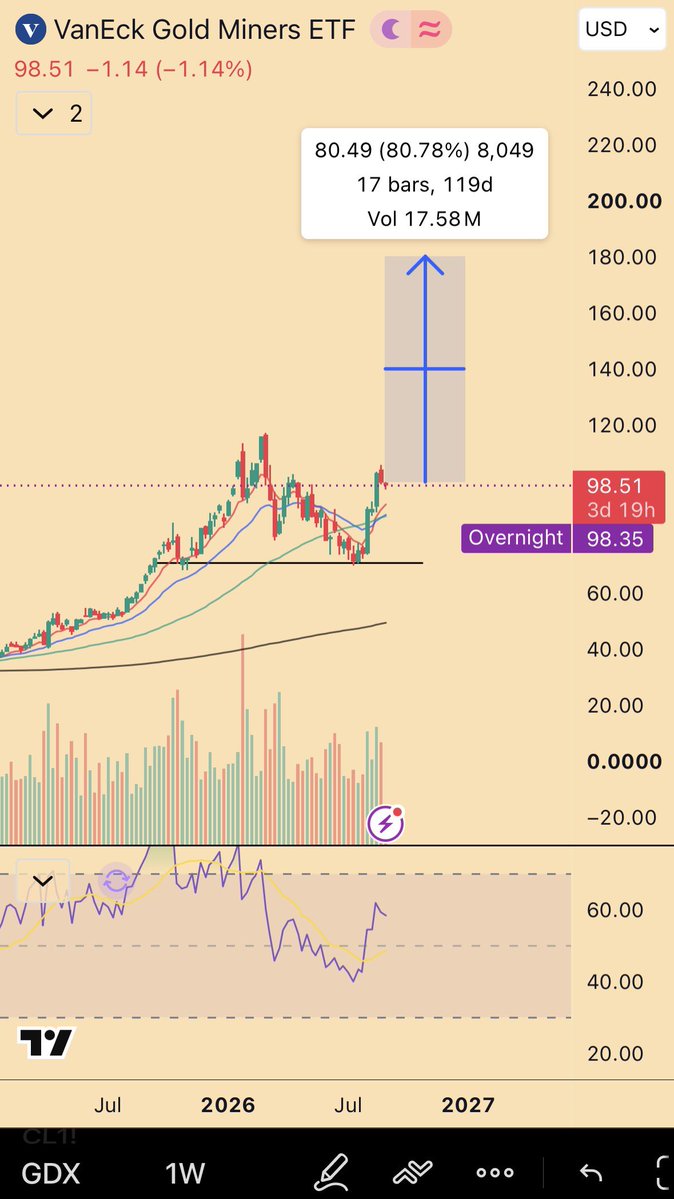
GDX (VanEck Gold Miners) at 98.51 (−1.14%) on the long-term map — the base David Hunter's $180 target sits on
Mandelbrot's most-seen post of the day (7.7K views) put David Hunter's gold-miner targets back on the timeline: GDX $180, GDXJ $250, SIL $220, SILJ $90 — "This year." He attached GDX's long-term chart at 98.51 (−1.14%), the map those targets sit on, and the replies filled in the sentiment: "David is right and am positioned very long gold."
$HYPE: Kraken Nod, Need Follow-Through
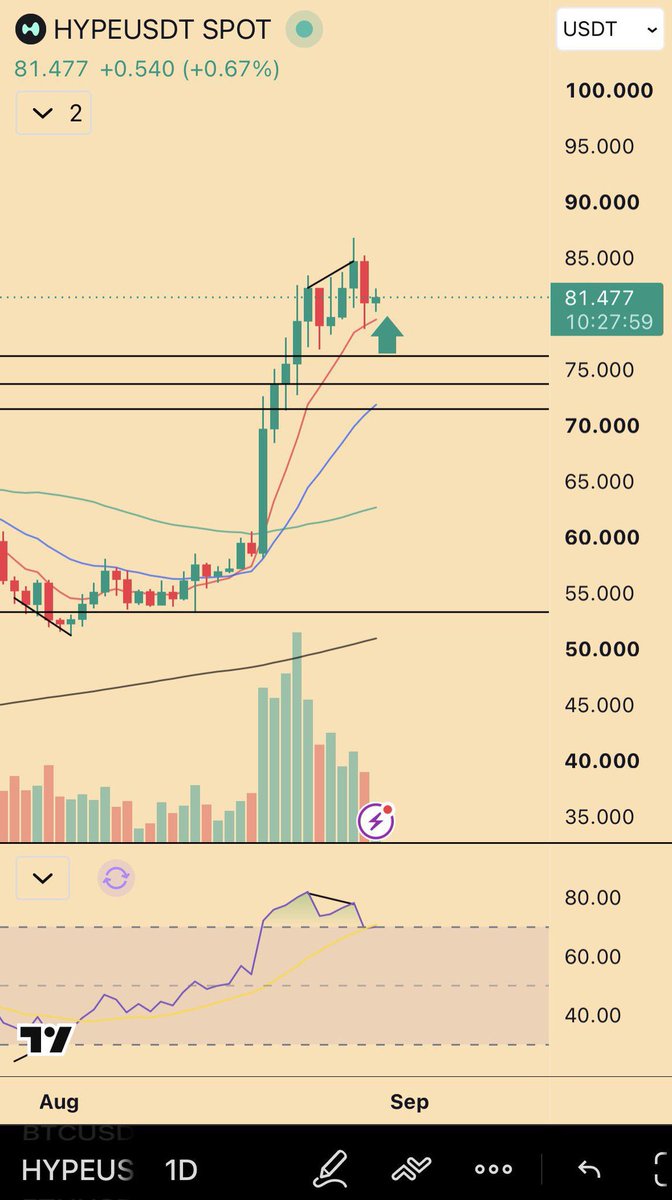
HYPEUSDT 1D at 81.48 (+0.67%) — the Kraken-nod pop that needs follow-through
HYPE got "positive incremental news with the Kraken nod yesterday", and Mandelbrot wants to see it hold: daily charts at 81.48 (+0.67%) and 83.90 (−0.34%) as the Kraken pop fades. "Need to see follow-thru though my friends." It echoes his prior HYPE post — a daily bearish divergence this early into the ATH break: "Where have I seen this movie before?"
First Time Since March 30th?
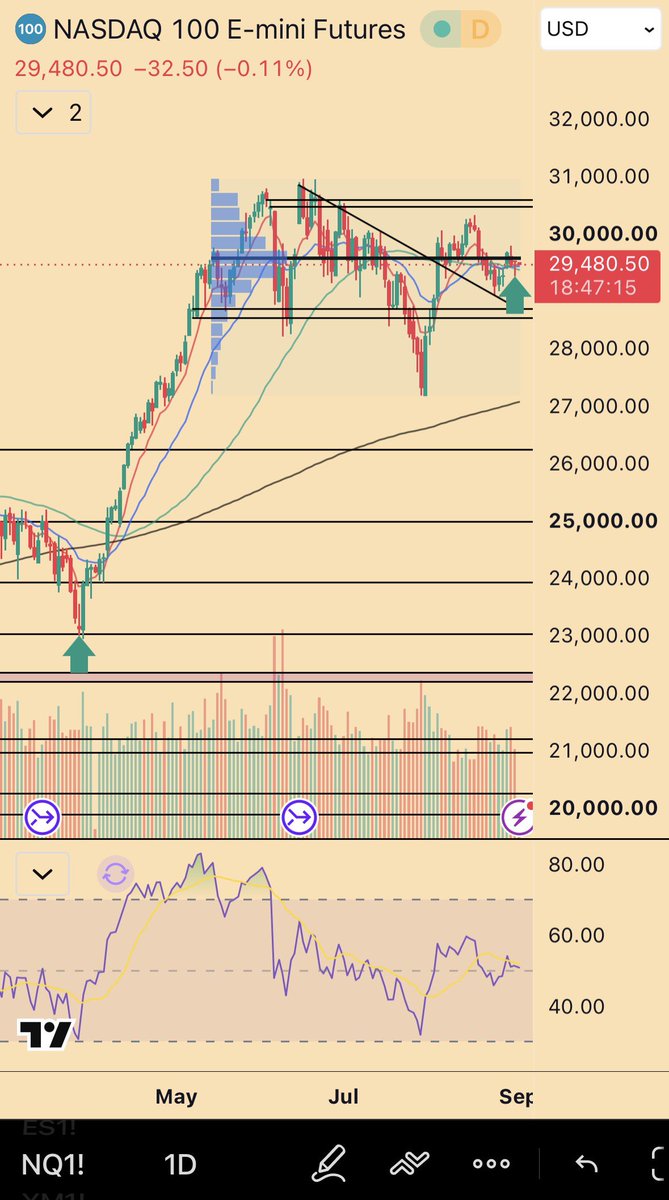
Nasdaq 100 E-mini futures at 29,480.50 (−0.11%) — the long view of a tape printing bear-market internals
Quoting Dr. Eric Wish's rare-breadth read — Monday printed more new yearly lows than highs for the first time since March 30, and just 13 new ATHs, the fewest since 12 on March 31, the day the February–March decline ended — Mandelbrot added a long-view NQ futures chart at 29,480.50 (−0.11%) and a reaction image that read "INFLATION IS TRANSITORY". "Very strange…"
Bear Market Internals, Pinned Indices (no chart)
Three minutes after the breadth chart came the one-line session summary: "Pretty much bear market internals, but indices are staying pinned… for now at least." Internals rolling over while the index itself refuses to follow — the state of play entering September.
The Squeeze Analog
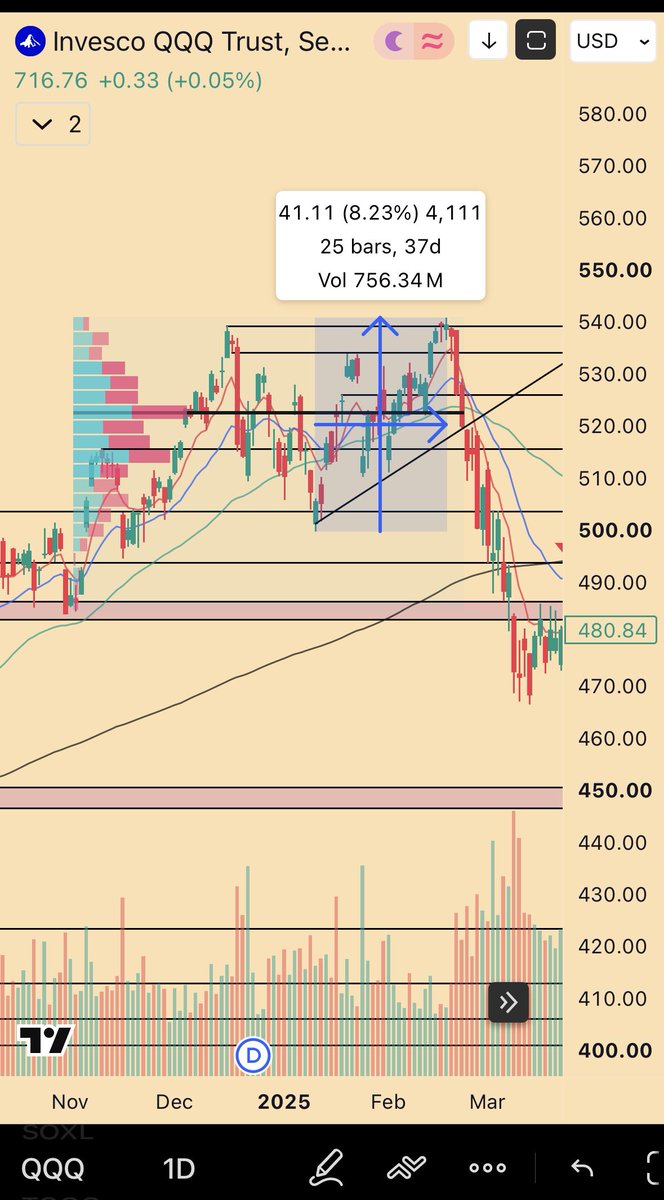
QQQ with the +8.23% / 37-day squeeze annotated — the last-time-10Y-was-this-high analog
The second chart in the 10Y thread annotated what happened last time: QQQ squeezed 41.11 (+8.23%) in 37 days after the 4.80% rejection. His follow-up keeps the door open: "I haven't yet subscribed to the idea that it's *over* after a potential pop in the short term, so ignore what ensued after that… But I know this analog probably gets @Parida jacked up."
His Book & Positions
No new position disclosures Monday night. The tape he is describing is hedge-friendly: bear-market internals with indices pinned, 10Y back at the 4.80% rejection zone, and his standing framing — long QQQ/SPX puts as tail hedges — untouched. The GDX $180 / GDXJ $250 / SIL $220 / SILJ $90 numbers are David Hunter's targets, amplified rather than his own entries; the replies show the gold crowd positioned long regardless. His only directional stance: not subscribed to "it's over" after a potential short-term pop.
Macro & Markets
The week opens with a 10Y at 4.784% (+0.63%) — the level that rejected at 4.80% last time and preceded an 8% Nasdaq squeeze — into a 2/3s priced-in rate hike and an Anthropic IPO that will draw on already-diminishing liquidity. Breadth is quietly deteriorating (new yearly lows beat highs for the first time since March 30; 13 ATHs, fewest since March 31) while indices stay pinned. Gold miners are the day's loudest side-theme via David Hunter's targets. "It's really hard to have any great bull ideas," Mandelbrot says — a reminder to understand the realm of possibilities, not a market call.