"Ideally this doesn't play out, but just make sure you're fine being a dip buyer at $63" — HYPE's test, a trimmed NBIS, and an honest "L" on the BTC puts
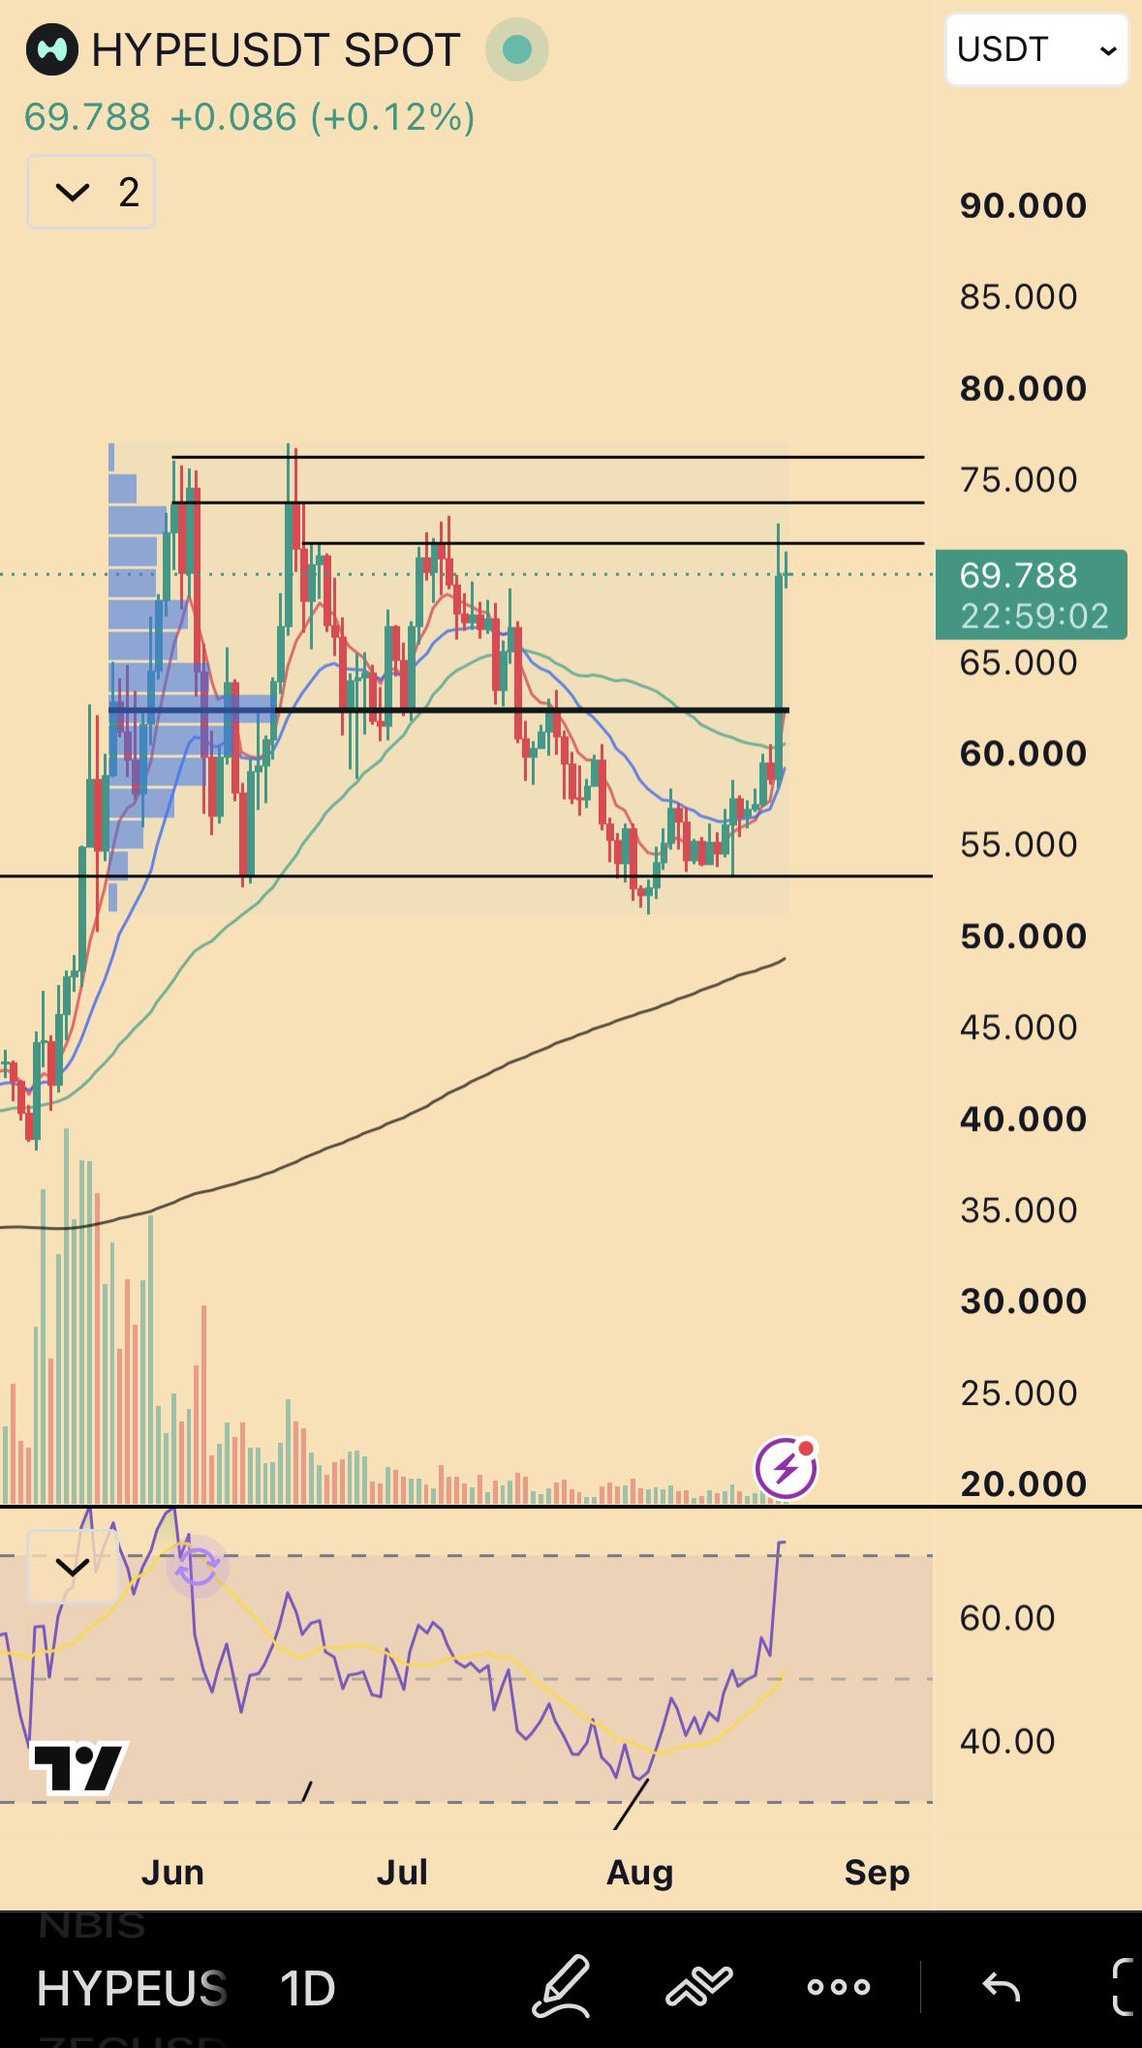
HYPEUSDT 1D at 69.79 — the $63 dip-buyer level drawn with the $72 invalidation overhead
The day's freshest call is a warning dressed as a level: with HYPE trading at 69.79, Mandelbrot wants followers to be honest about whether they're willing dip buyers at $63 — and notes the "idea" only dies if $72 clears with strength. In the same post he admits taking off about 30% of his NBIS position on the pop, "partially explained by compensating for my L on the BTC puts. Not super rational…" The chart itself is the quieter message: the level map that says exactly where the risk sits.
$NBIS — Long Around $220, the $200 Earnings Gap, Saved by the Close
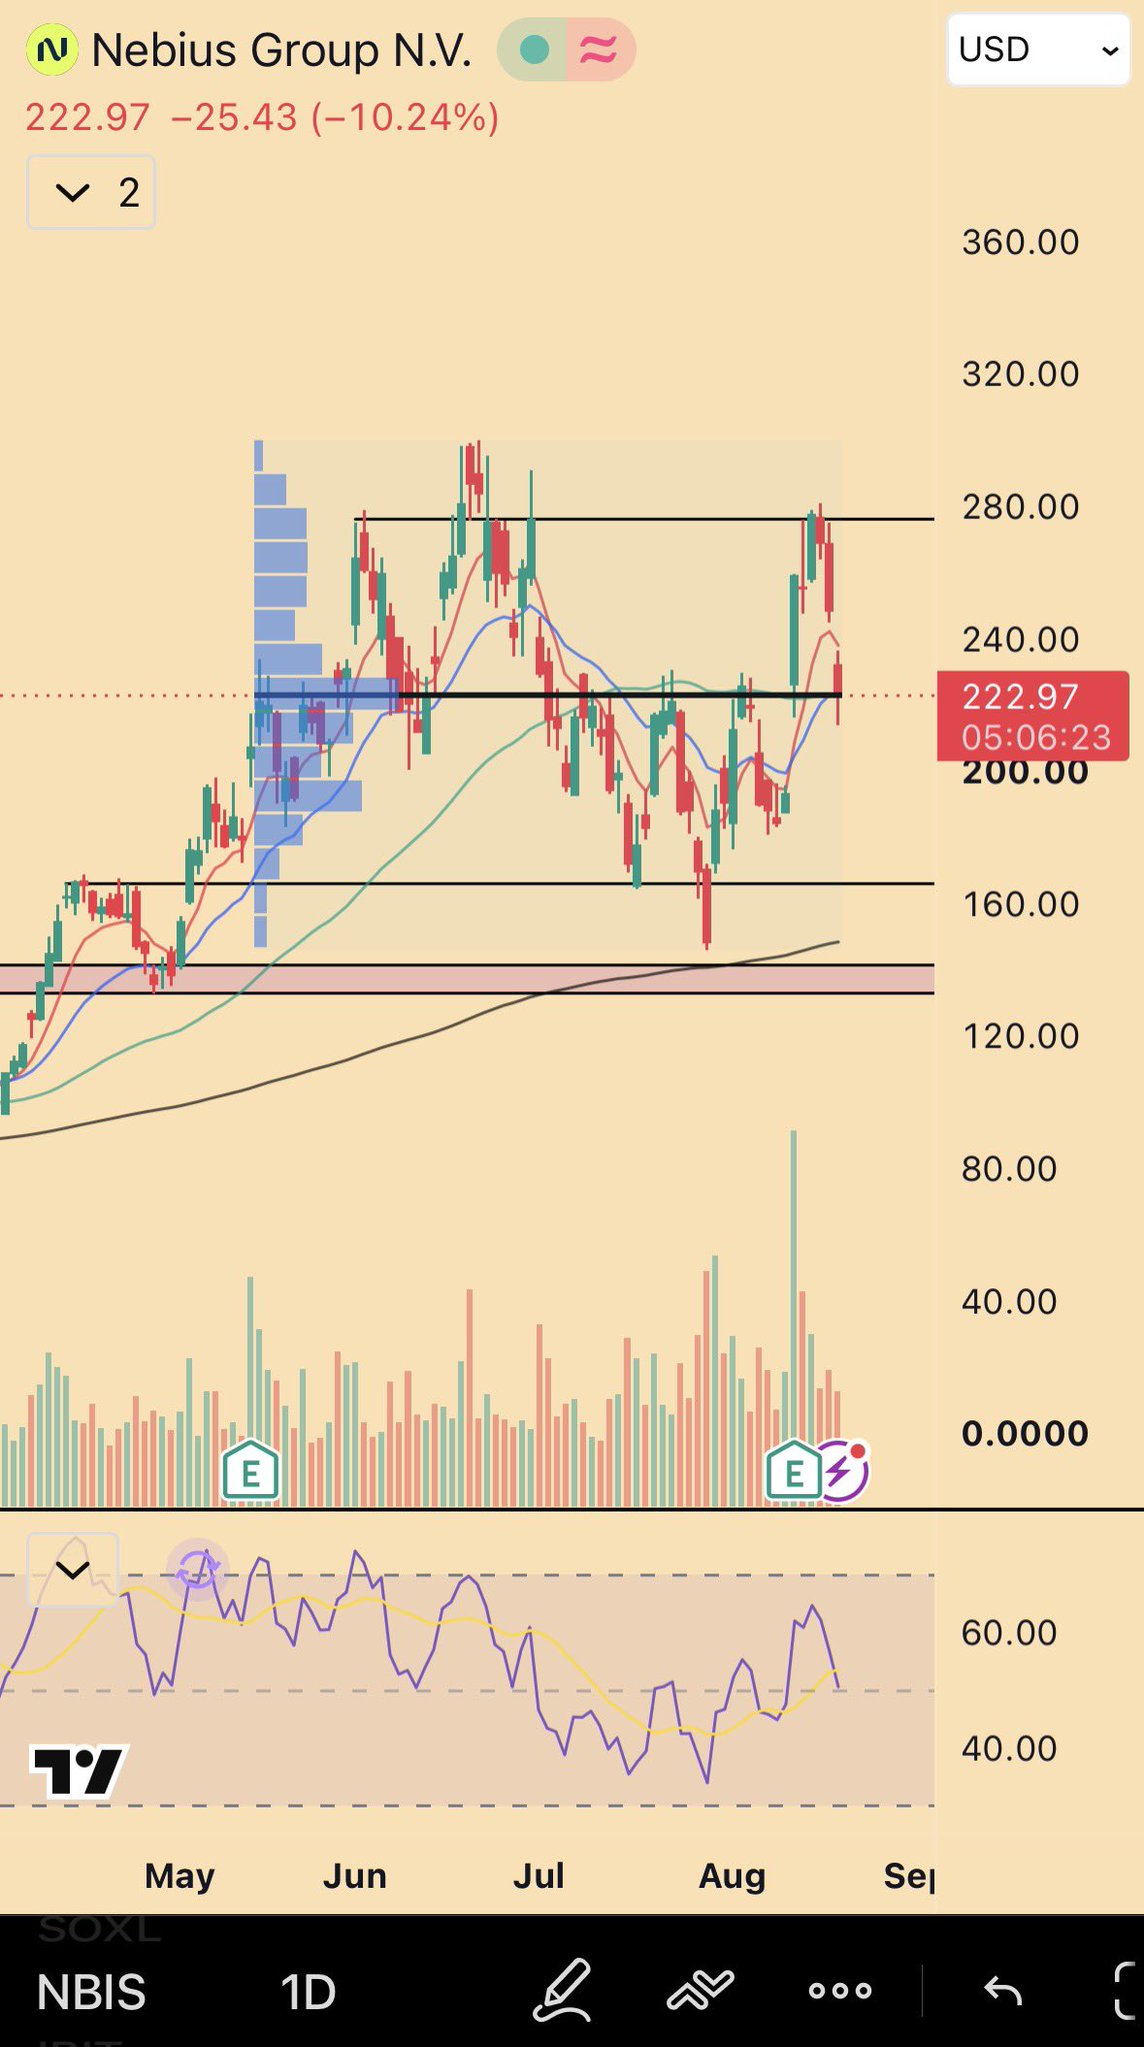
Nebius (NBIS) 1D — the red session at 222.97 (-10.24%) where the $220 long went on
The morning trade: "Long around $220 this morning (should have filled before victory lapping — lesson in there). Such a critical level here. Close below $220 and I'd assume that $200 earnings gap gets filled. Good r:r for an attempt though." The pre-market chart had already shown the pain — Nebius down to 214.80 (-13.44%) in the early session, prompting a terse "Faded?" — before he stepped in near $220. By the close it had clawed back to 223.95 (-9.85%): "Saved by the close… If I'm just playing the chart, I hold, but Warren has me a little worried. Something for you to consider, chart says good R:R, but fundamentals may be loosening."
$ETH — "Does This Make You Nervous?"
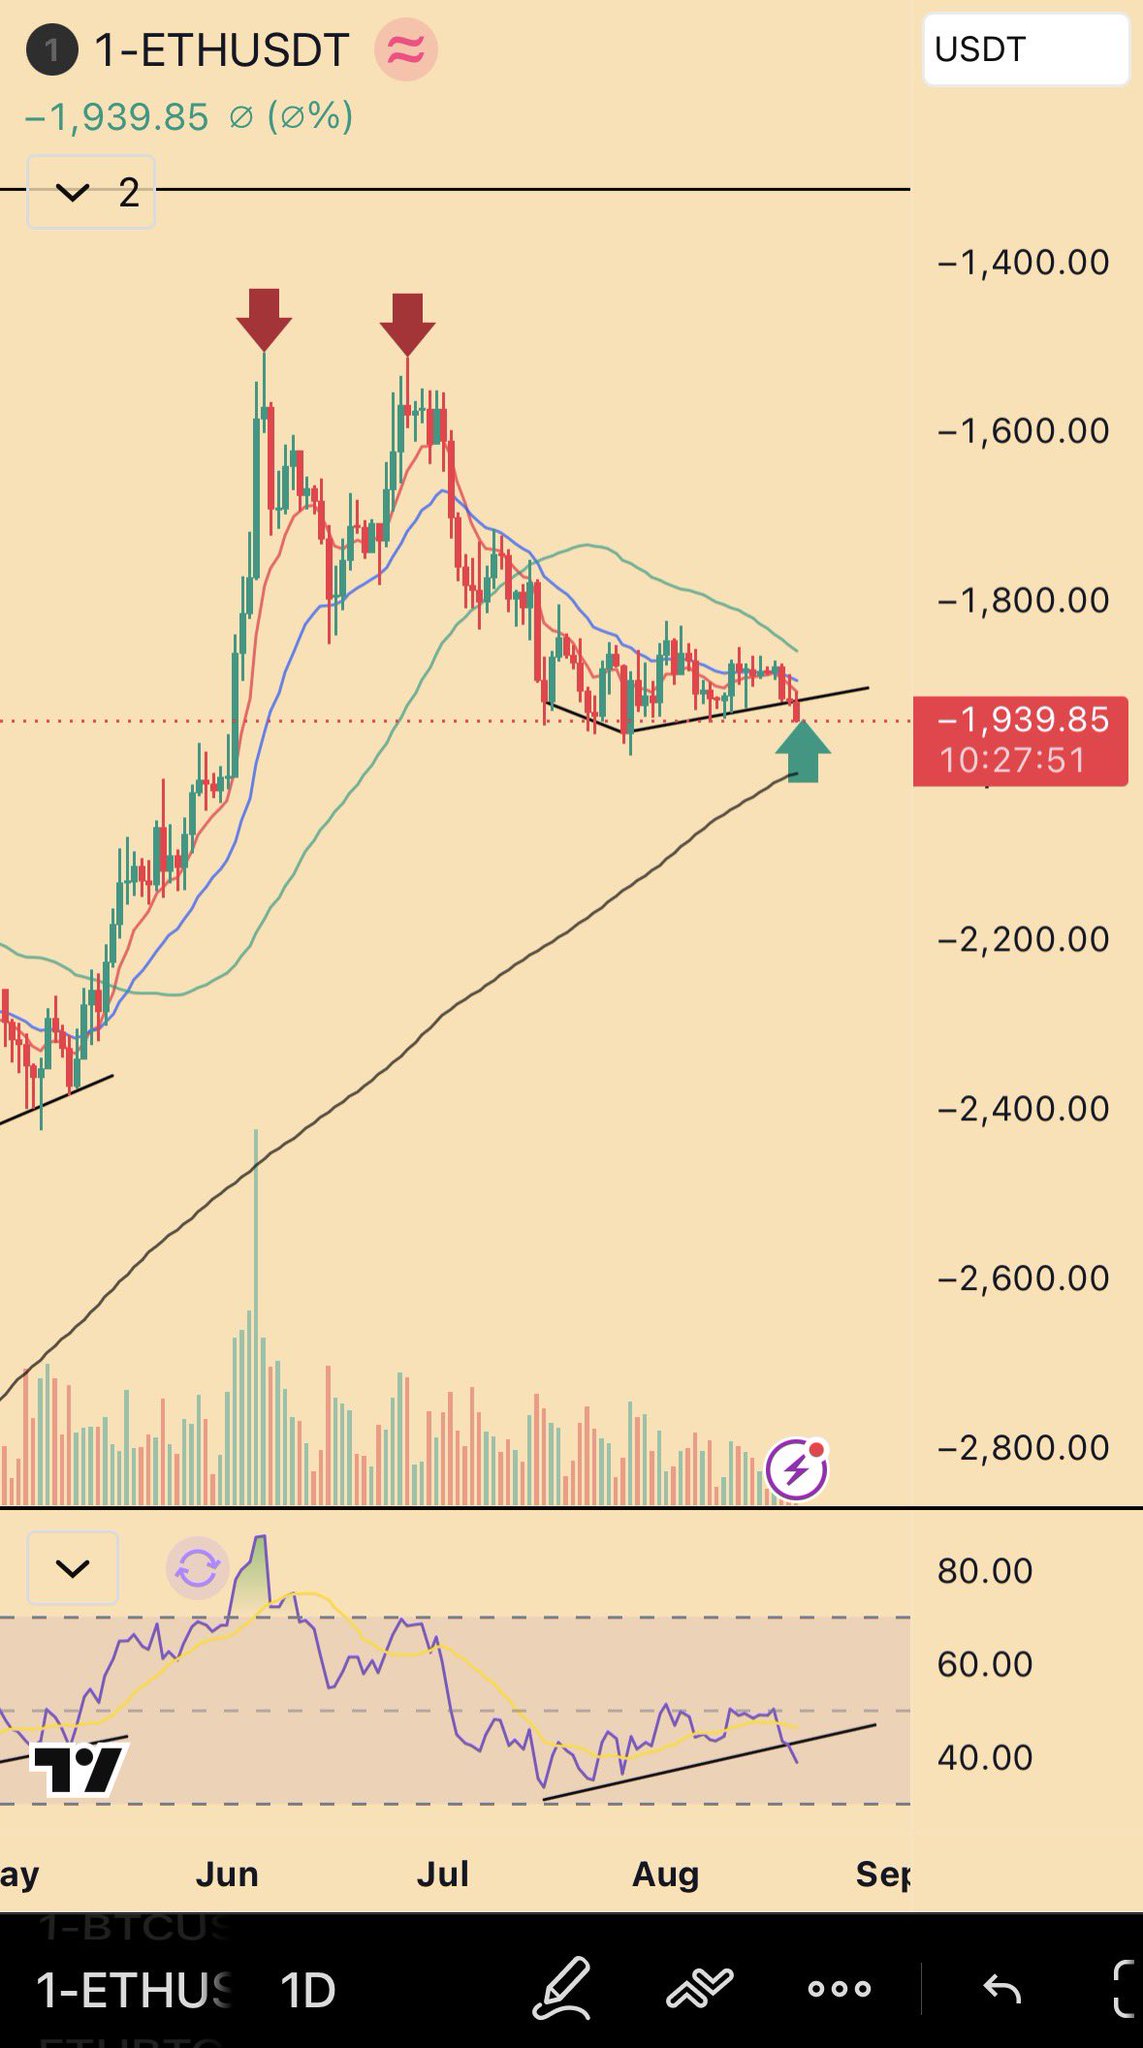
ETHUSDT chart with the P&L panel marked down (-1,939) — the setup he's calling nervous ahead of Aug 20
The arrow he planted the day before pointed at Aug 20 — "Aug 20 is the date of this randomly placed arrow btw. Let's watch" — and this morning's chart asks the room whether they're nervous about the drawdown in view. In the thread's follow-up he layers the macro on top: "The news today combined with tech sucking wind makes this less likely to come to fruition. Metals and crypto make complete sense off this vs. US assets, but jury is still out that both of the former can rip together. Important next few days for crypto to show its direction." The position panel on the chart is visibly underwater — the point of the question.
Gold & Crypto vs. US Assets — "Hard to See Why They Don't Keep Running"
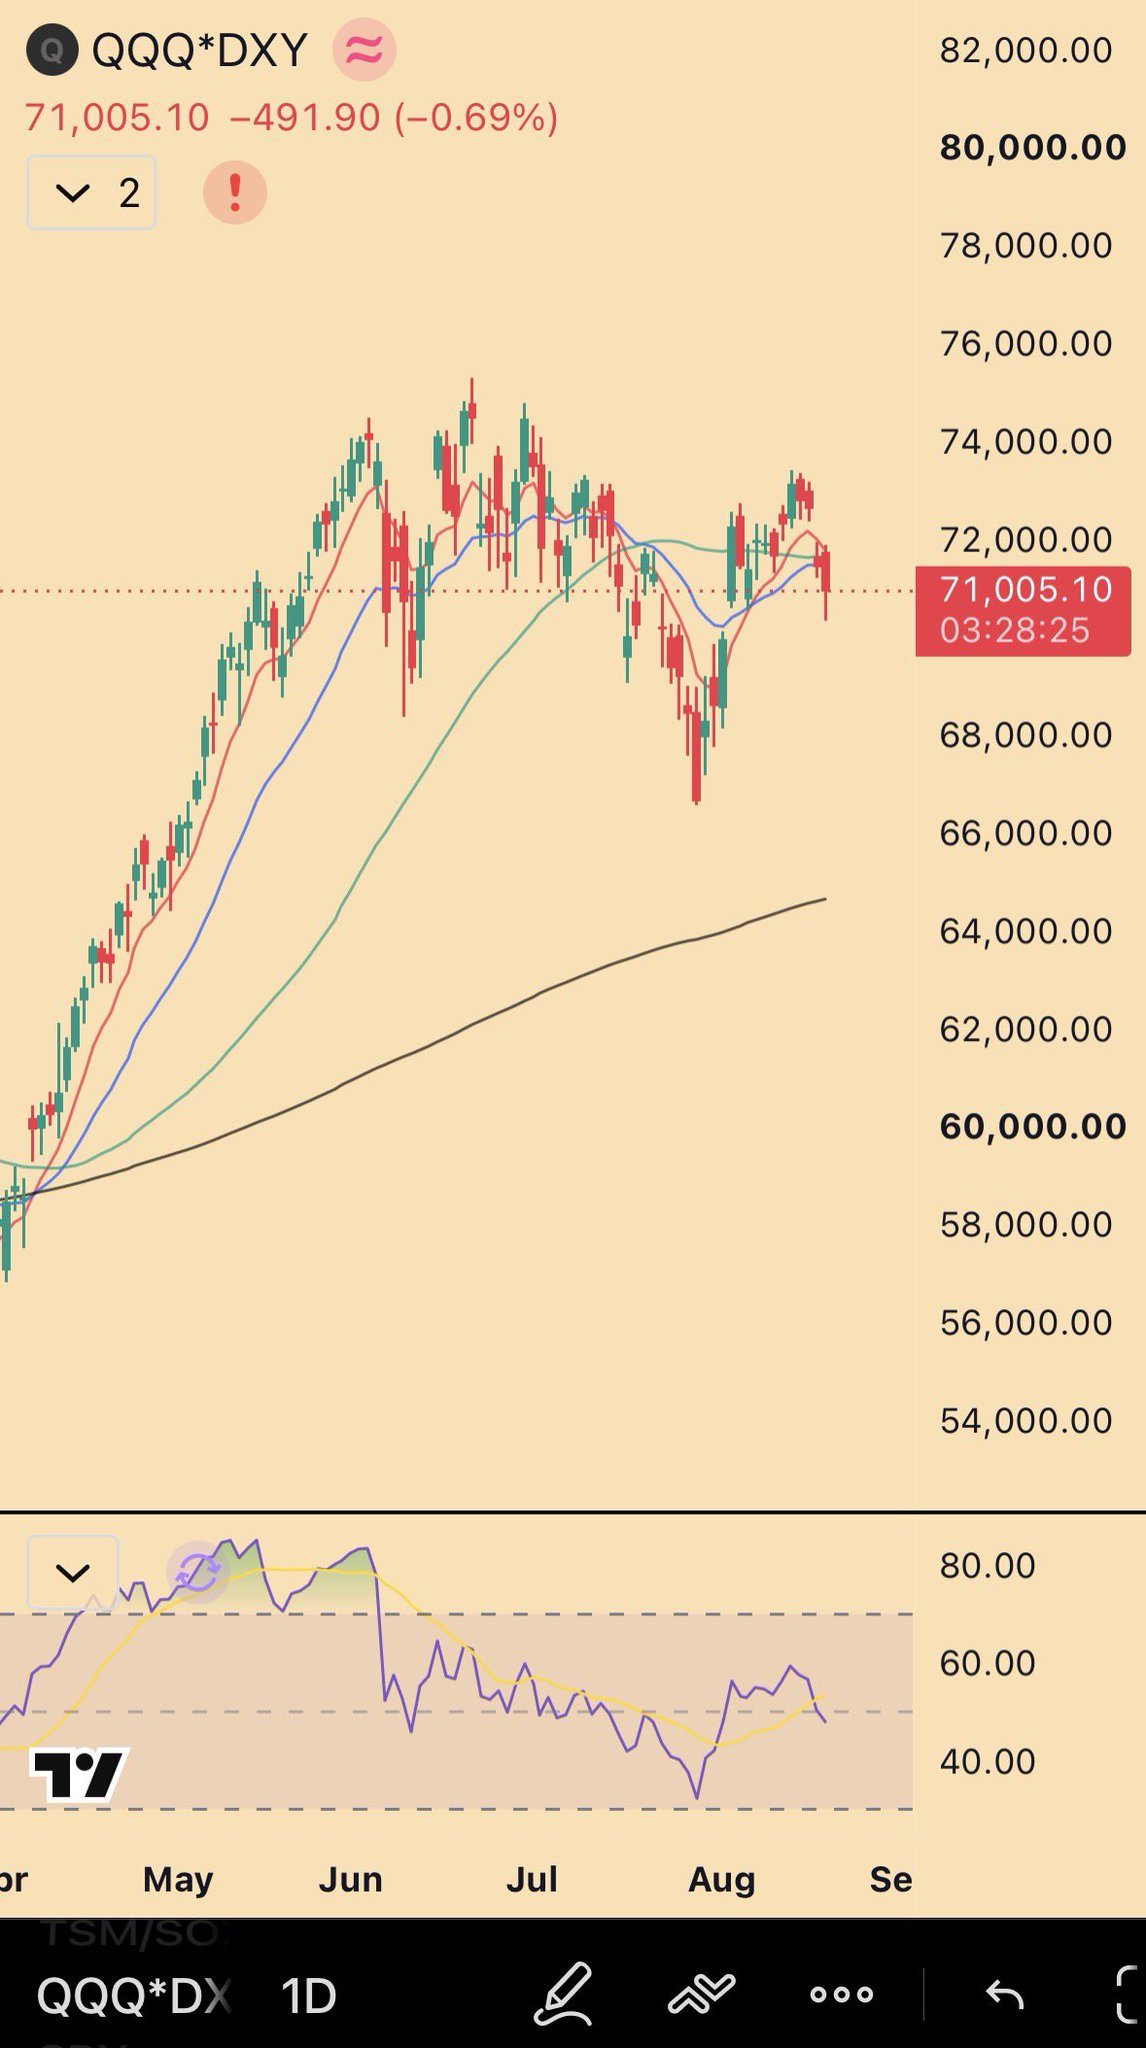
QQQ*DXY at 71,005 (-0.69%) — the weak-dollar lens on US equities
"It's hard to see why gold and crypto don't continue running off this. But I'm pretty mixed on US assets here." The reply-with-chart, addressed to the commenter who closed his shorts and puts into the announcement, carries his honest two-sided read: "You could still be right though, US indices may just be an underperformer while this news caps any realized vol to the downside." The attached QQQ*DXY product chart at 71,005 (-0.69%) is the dollar-driven tape he keeps circling — the underperformer thesis, drawn.
The Dollar Sacrifice — What Do the Foreign Buyers Think?
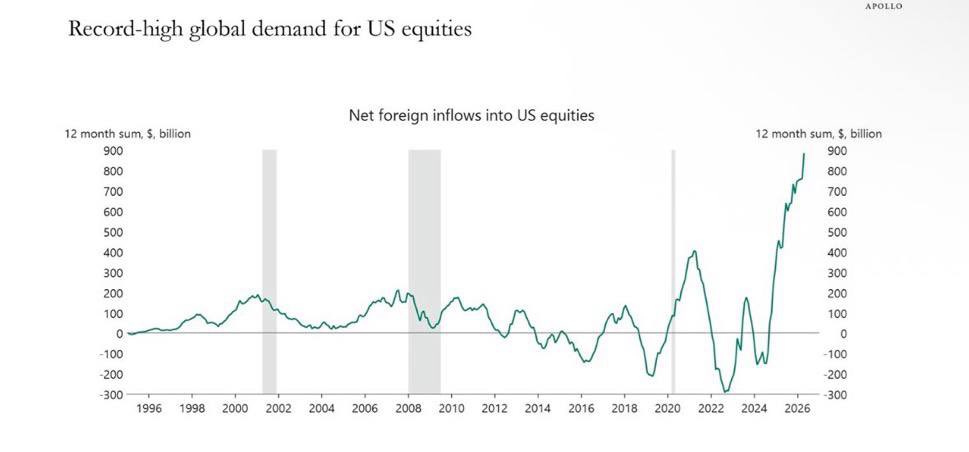
Record-high foreign inflows into US equities (12-month sum) — the buyers watching the dollar get "sacrificed"
"Let's see what all these foreign buyers think of the treasuries' decision to 'sacrifice the dollar.' (They're probably hedged, but let's play with the narrative anyway.)" The chart underneath is the punchline: record-high global demand for US equities, 12-month sum of net foreign inflows at all-time levels. The QQQ*DXY companion frame (70,975, -0.73%) shows the same dollar slide in equity terms. The narrative is simple — the buyers who funded the bull market are being paid in a depreciating reserve currency — and he's explicit that the hedge assumption is doing a lot of work.
Gold vs. the S&P — 0.582 and Rising
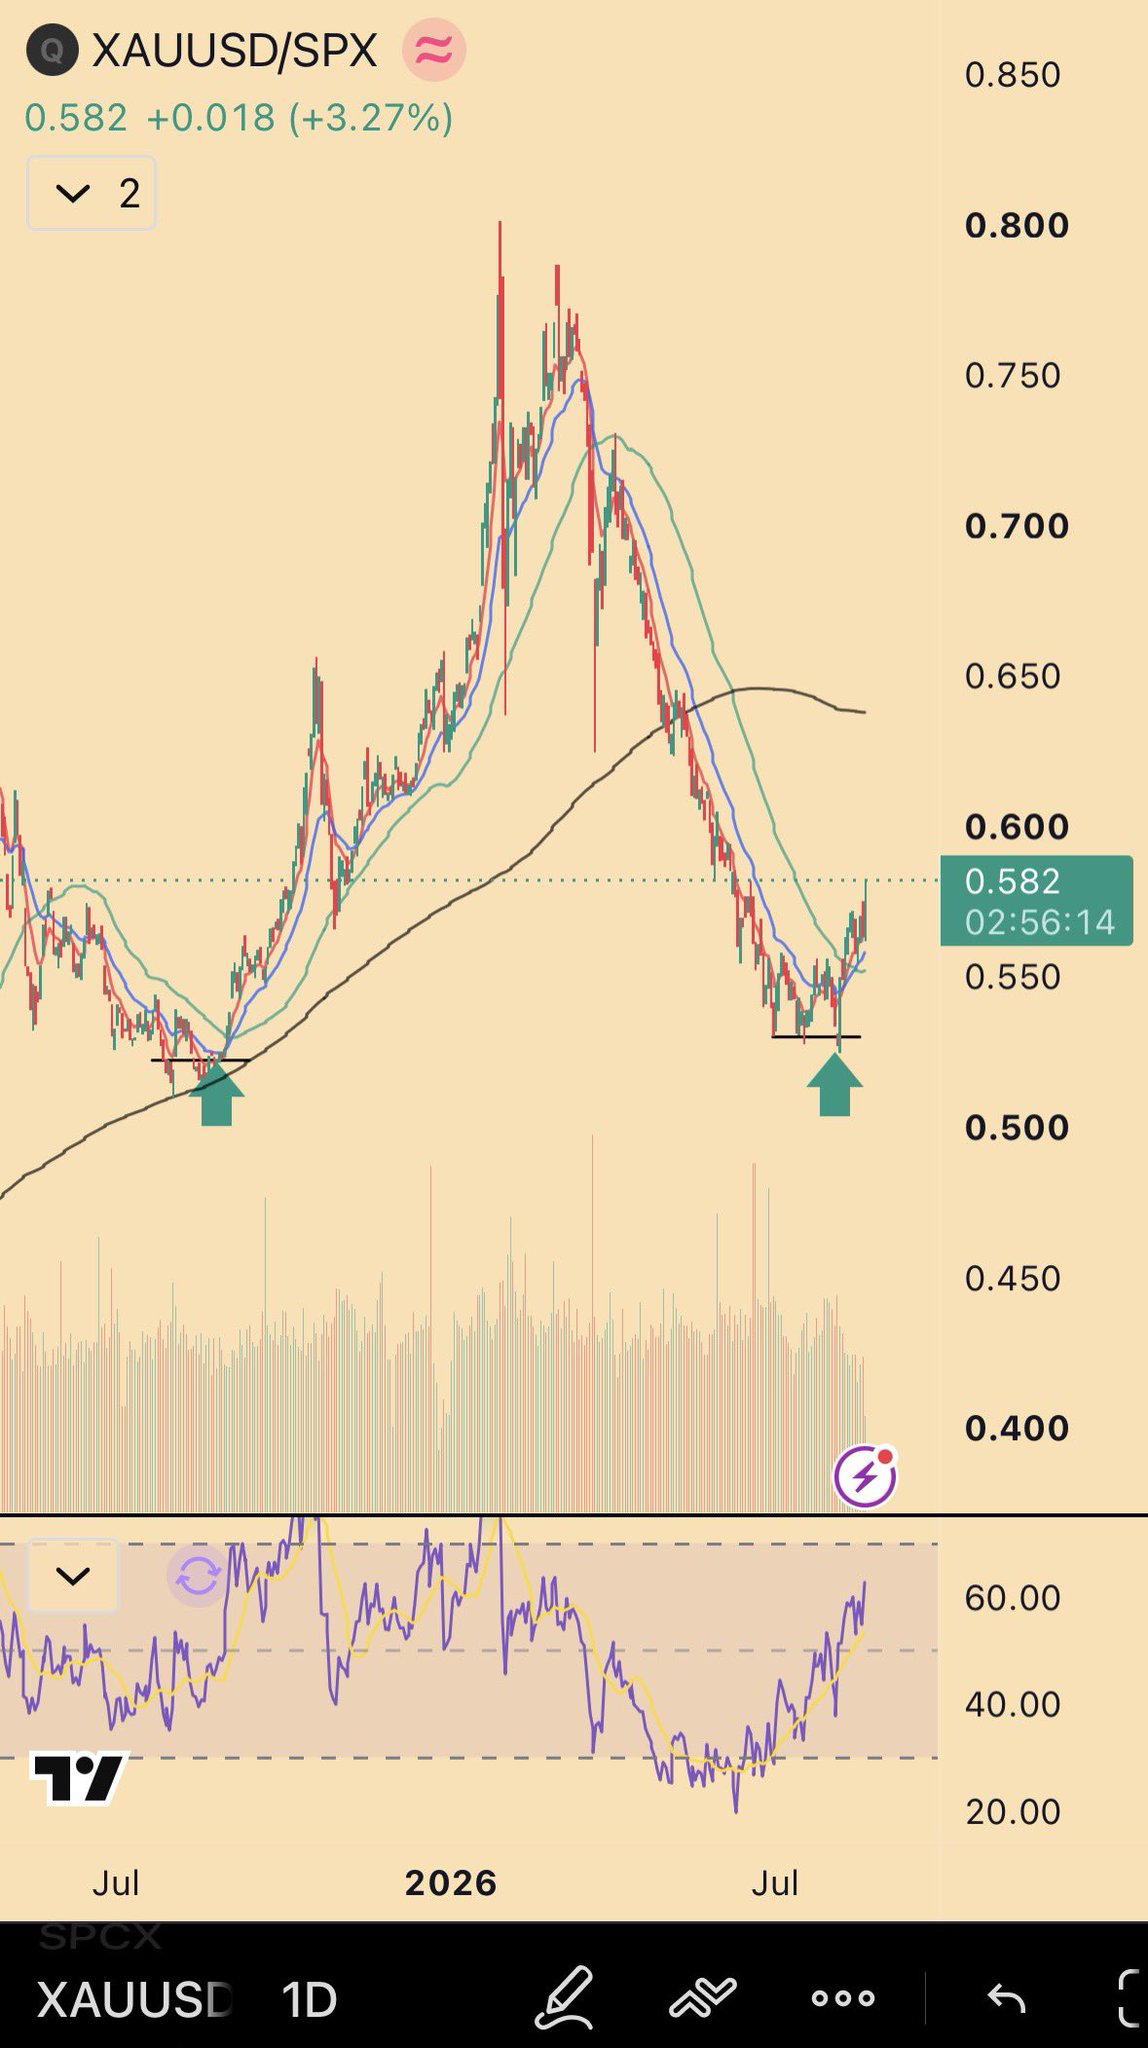
XAUUSD/SPX ratio at 0.582 (+3.27%) — gold's outrun of the S&P
The third frame of the treasury post is the ratio trade that keeps printing: XAUUSD/SPX at 0.582, +3.27%, grinding higher as the dollar weakens. It's the visual for his standing conviction that metals make complete sense off this vs. US assets — while the jury stays out on whether metals and crypto can rip together. The ratio is the cleanest expression of the rotation: gold quietly outrunning the S&P in dollar terms.
$QQQ — Fill the Gap Before Jackson Hole (no chart)
"Let's see if we can fill this gap before JHole…" The request is modest — a gap fill, ideally with a close above the daily trend and "most importantly the POC" — but the setup has him fighting his own brain: "QQQ is red during peak OPEX flows + announcement of pseudo YCC (positive news getting faded), but perhaps delayed reaction." The pseudo-YCC read is the whole day in miniature: the dollar-sacrifice news is supposed to be bullish risk, and the tape is fading it — for now. (The tweet's chart image was no longer retrievable from X.)
AI — Scalp Longs On, and Something to Chew On (no chart)
"Hmm. I put some AI scalp longs on today, but something to chew on…" — the quote is Warren Pies on the data-center complex: "Over the past week, we are seeing some early cracks in our GPU availability data...not going to overreact but have to call balls and strikes...On net, bad combo w/ the Anthropic ARR miss." Pies' follow-up keeps the tone calibrated: "Will write more on it tomorrow…situation to monitor…not panicking yet but notable." It's the same thread that has him "a little worried" on NBIS — the chart says hold, the fundamentals tape says watch.
SPX*DXY — "A Pretty Significant Deviation" Masked by the Weak Dollar
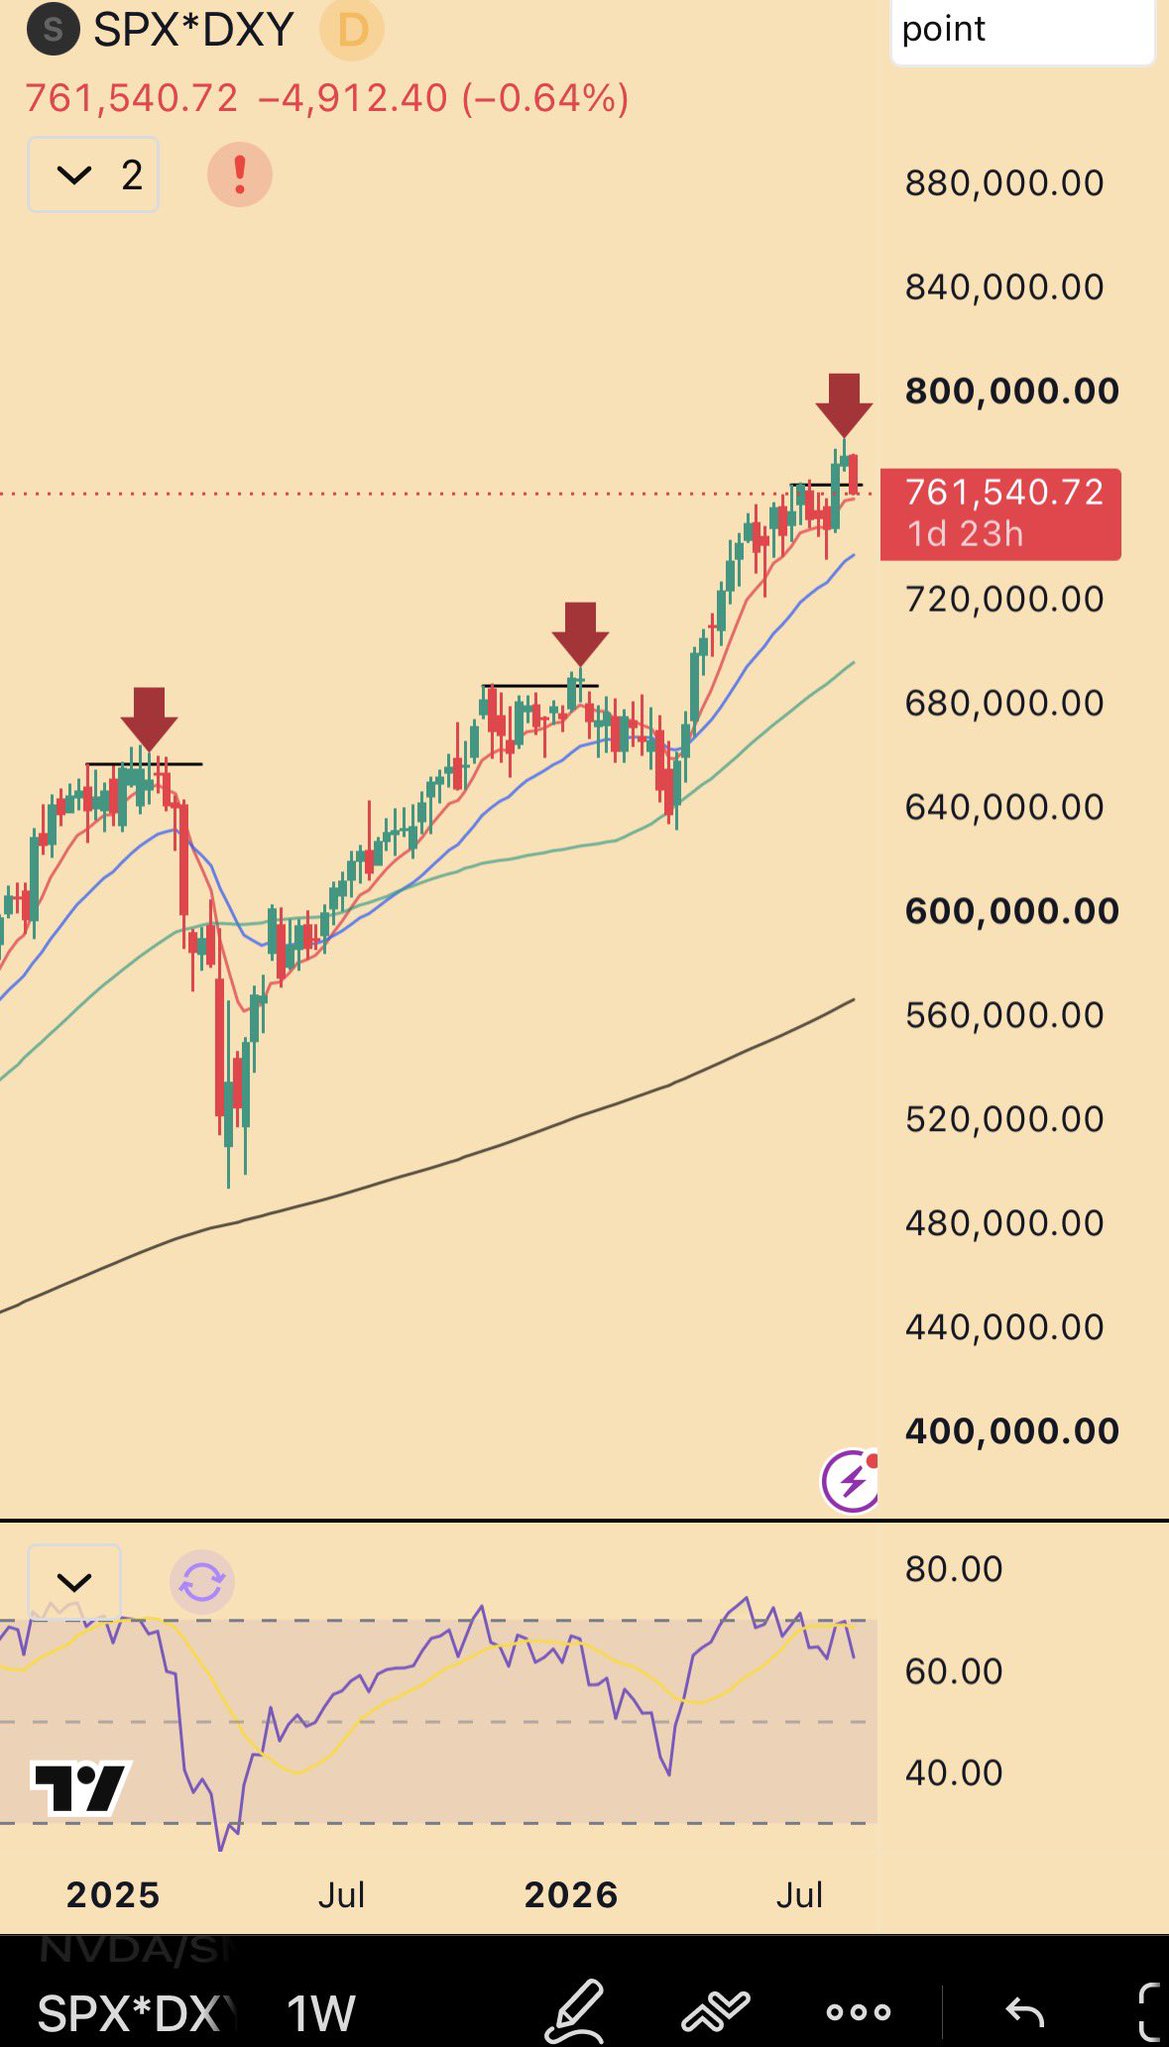
SPX*DXY weekly at 761,540 (-0.64%) — record altitude on the product, deviation underneath
"Let's see how the week closes out. But for now, a weak US dollar is masking what could be a pretty significant deviation." The charts: SPX*DXY at 761,556 on the daily (-4,897, -0.64%) and 761,540 on the weekly — a product at record altitude even as the S&P itself stalls. His framing is that the dollar's slide is flattering the equity tape, and the deviation underneath only shows itself when the mask comes off. How the week closes out — and whether the weekly holds — is the tell.
His Book & Positions
New disclosures overnight: ~30% of the NBIS position taken off on the pop — "partially explained by compensating for my L on the BTC puts. Not super rational…" (the BTC-put loss is his own admission). NBIS long around $220 still held into the close at 223.95; chart says hold, but "Warren has me a little worried" on fundamentals. HYPE: wants to be a dip buyer at $63; idea invalidated only if $72 clears with strength (at 69.79). Intraday: AI scalp longs put on. Carried from prior days: Oct 30 SPX puts, below-66k weekly BTC/IBIT bias.
Macro & Markets
The treasury 'sacrifice the dollar' decision is the day's axis: foreign buyers (record 12-month inflows into US equities, probably hedged) get paid in a depreciating currency; XAUUSD/SPX at 0.582 (+3.27%); QQQ*DXY fading at 70,975-71,005. 'A weak US dollar is masking what could be a pretty significant deviation' — SPX*DXY at record ~761.5k, -0.64%. His synthesis: gold and crypto make complete sense off this vs. US assets, US indices may just be the underperformer while the news caps realized vol to the downside — but the jury is out on metals AND crypto ripping together, and the next few days are important for crypto to show its direction. QQQ red during peak OPEX + pseudo-YCC announcement: 'positive news getting faded, but perhaps delayed reaction' — watching the gap fill before Jackson Hole.