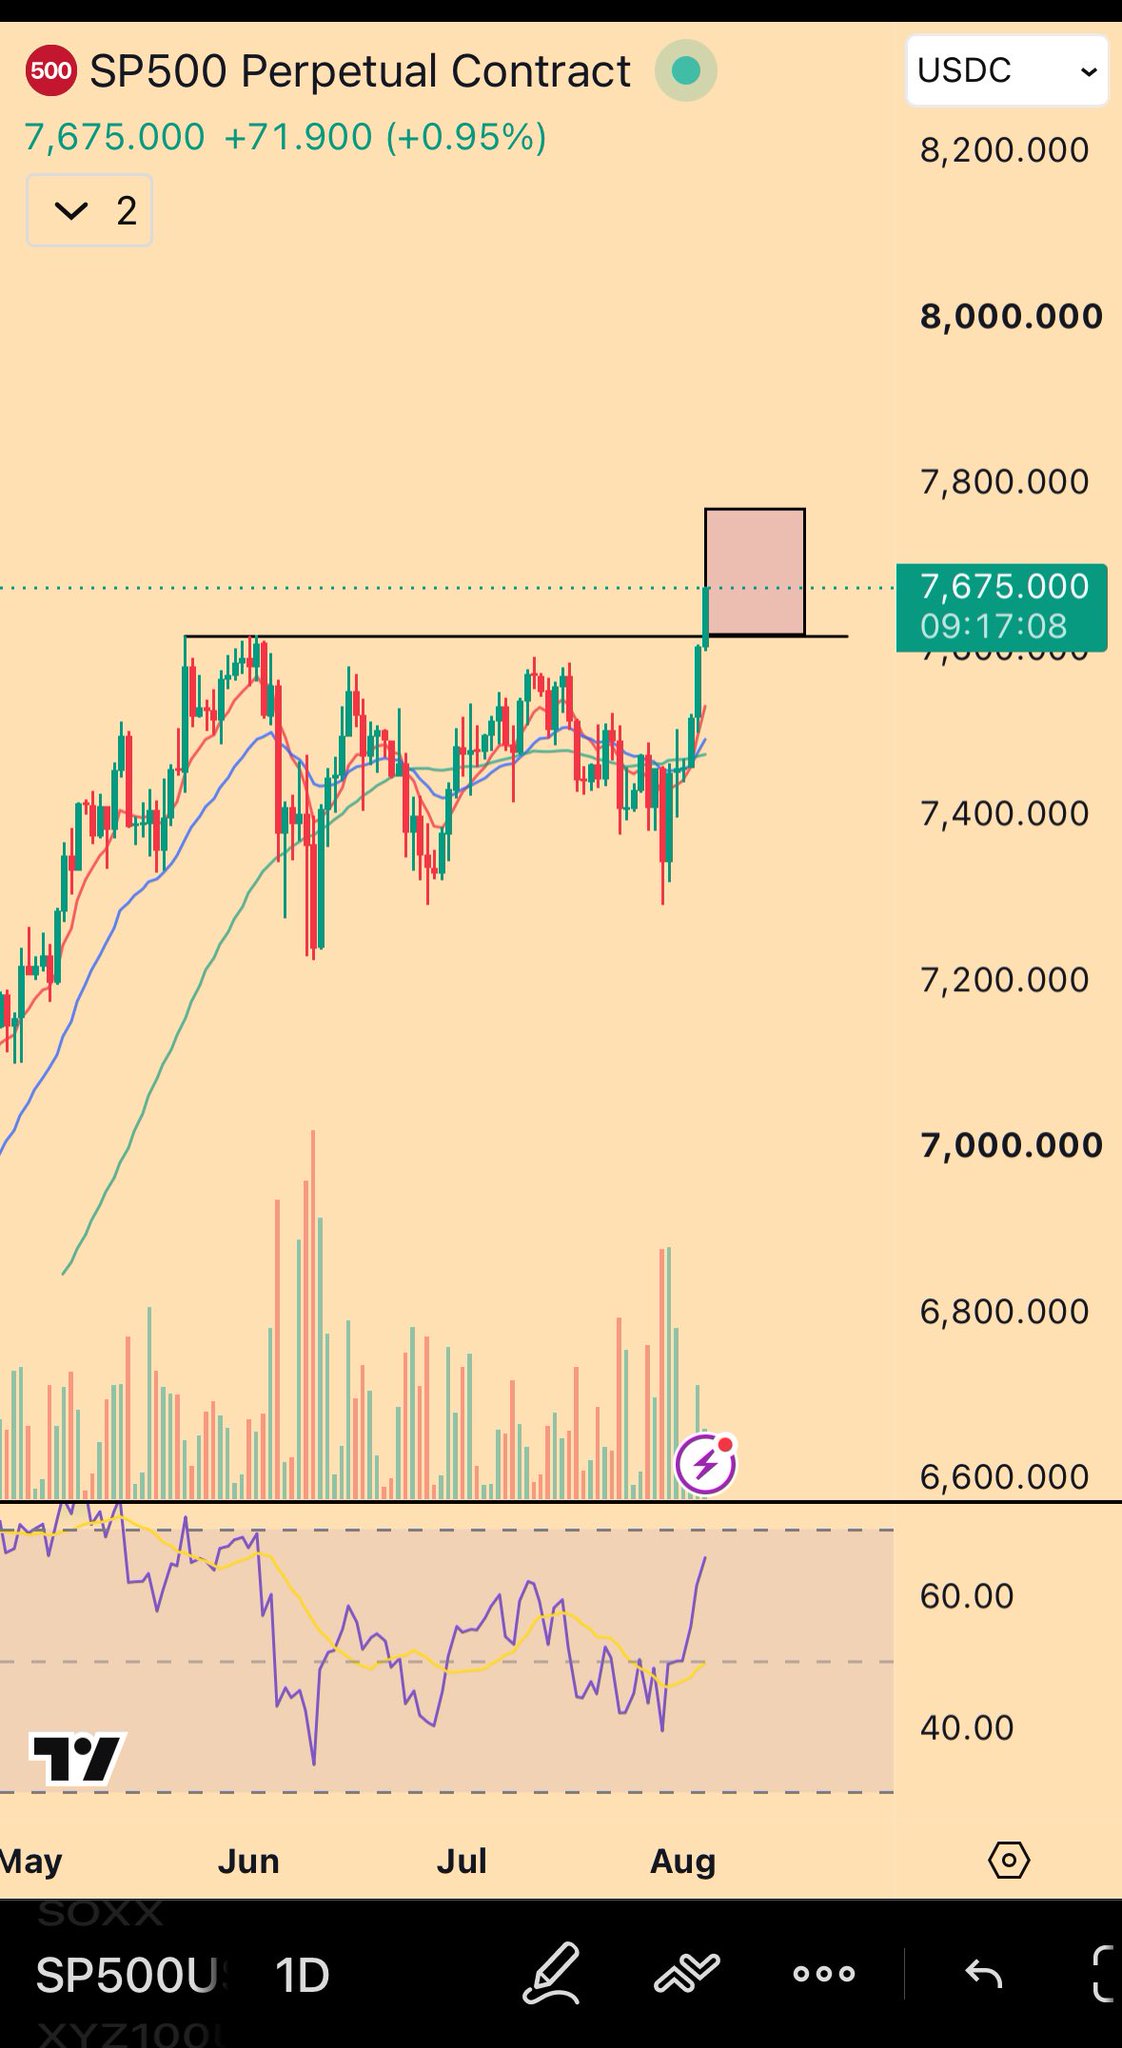
"Accumulated all the Oct 30 puts I wanted around the top of the target box" — then warns of "some fuckery" as the daily trend meets tomorrow's vixpiration
SP500 daily chart — the move up into the top of the box where he loaded the puts
The day's most important call is a completed defensive fill: Mandelbrot says he "accumulated all the Oct 30 puts I wanted around the top of the target box," the daily-chart target zone near 7,800 that price has just tapped. With tomorrow's vixpiration arriving as price walks into the daily trend, his read is explicit: "would expect some fuckery for the remainder of the week." The put accumulation buys the move out of the box without betting its direction — the trend interaction does the rest.
$SPX — Sold Into Strength Despite the OPEX Machine
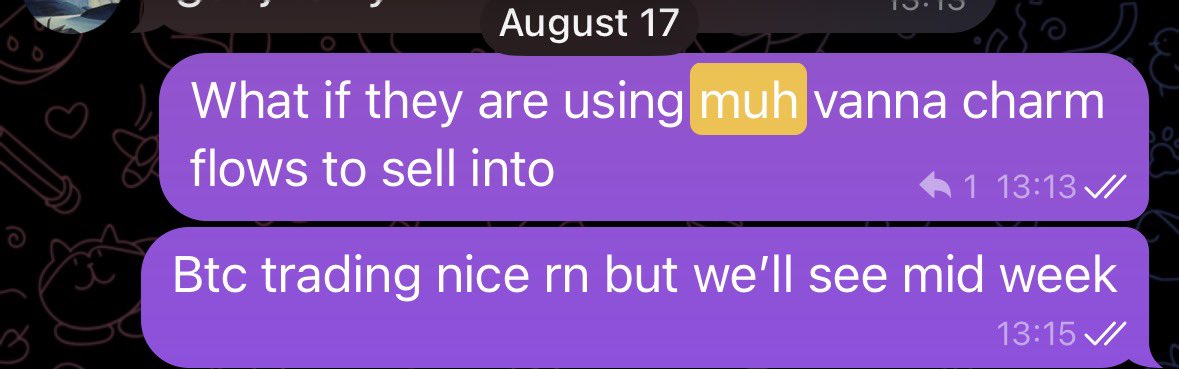
The Aug 17 screenshot reply — "what if they are using flows to sell into strength"
Attached to the puts thread, a reply chart and an observation that cuts against the usual expiration-week story: "I'll be honest it's quite interesting that the indices were sold pretty hard despite muh heightened opex flows." The attached screenshot (his Aug 17 post asking whether flows were being "used" to sell into strength) is the connective tissue: big-week options machinery present, tape selling anyway — which is precisely why the puts hedge was worth filling.
$BTC — Still Below the Most Important Level
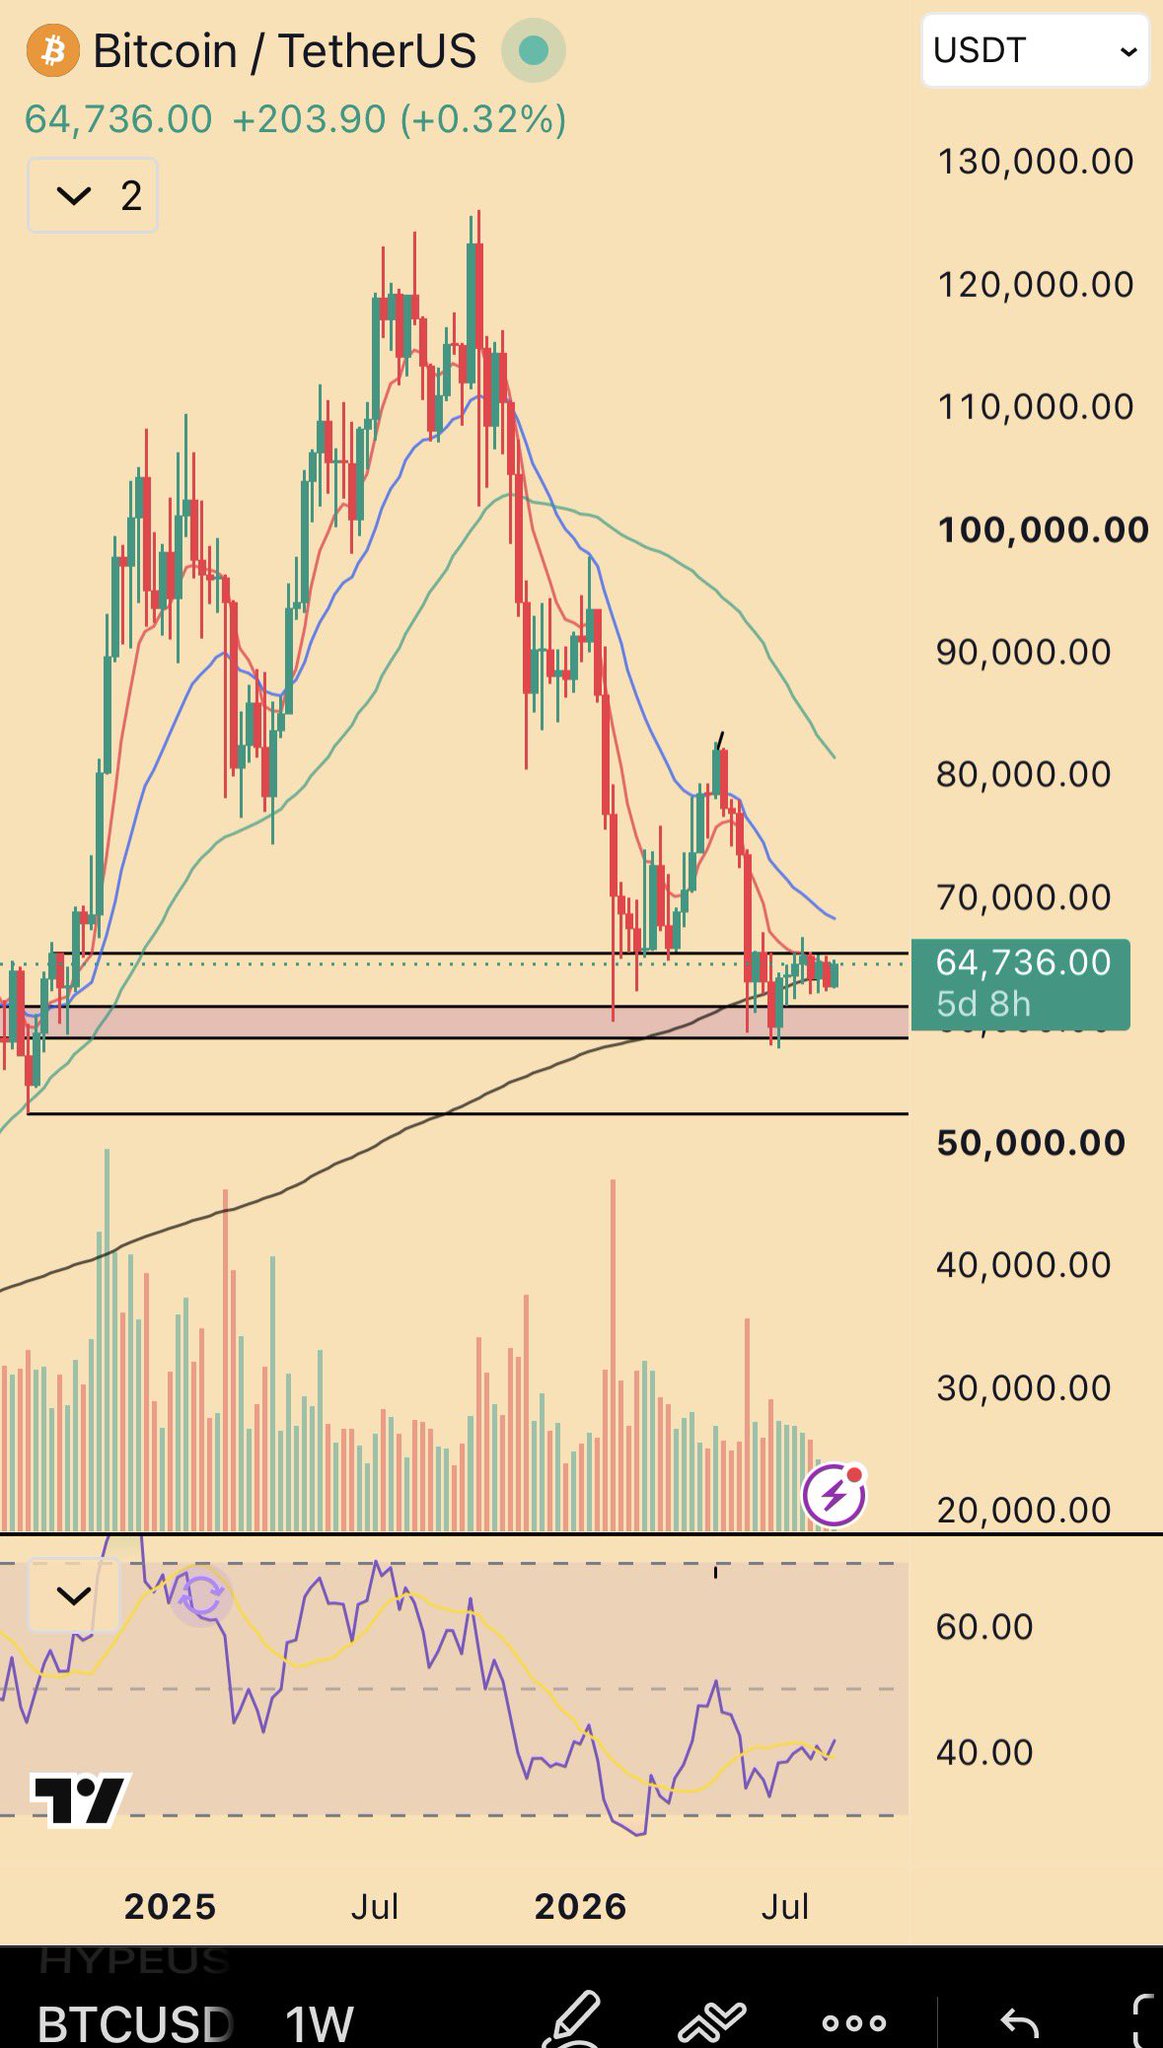
BTC weekly — two-hundred days of the same price, one neutered leg up
The crypto read is terse and unchanged: "Nothing really to update. Still below the most important level." He punctures the short-squeeze euphoria lighting up OPEX week's opening — "some local excitement (euphoria) as vulnerable shorts get squeezed" — with his structural frame: "same price for 200 days, with one artificial leg up driven by billions of demand from a STRC product that is neutered." In a reply on the same thread he asks for "an impulsive green candle that is driven by large spot demand," not "this brownish motion type action that just seeks the nearest liquidity."
$BTC/$IBIT — Below 66k Weekly, Expect the Lower Level
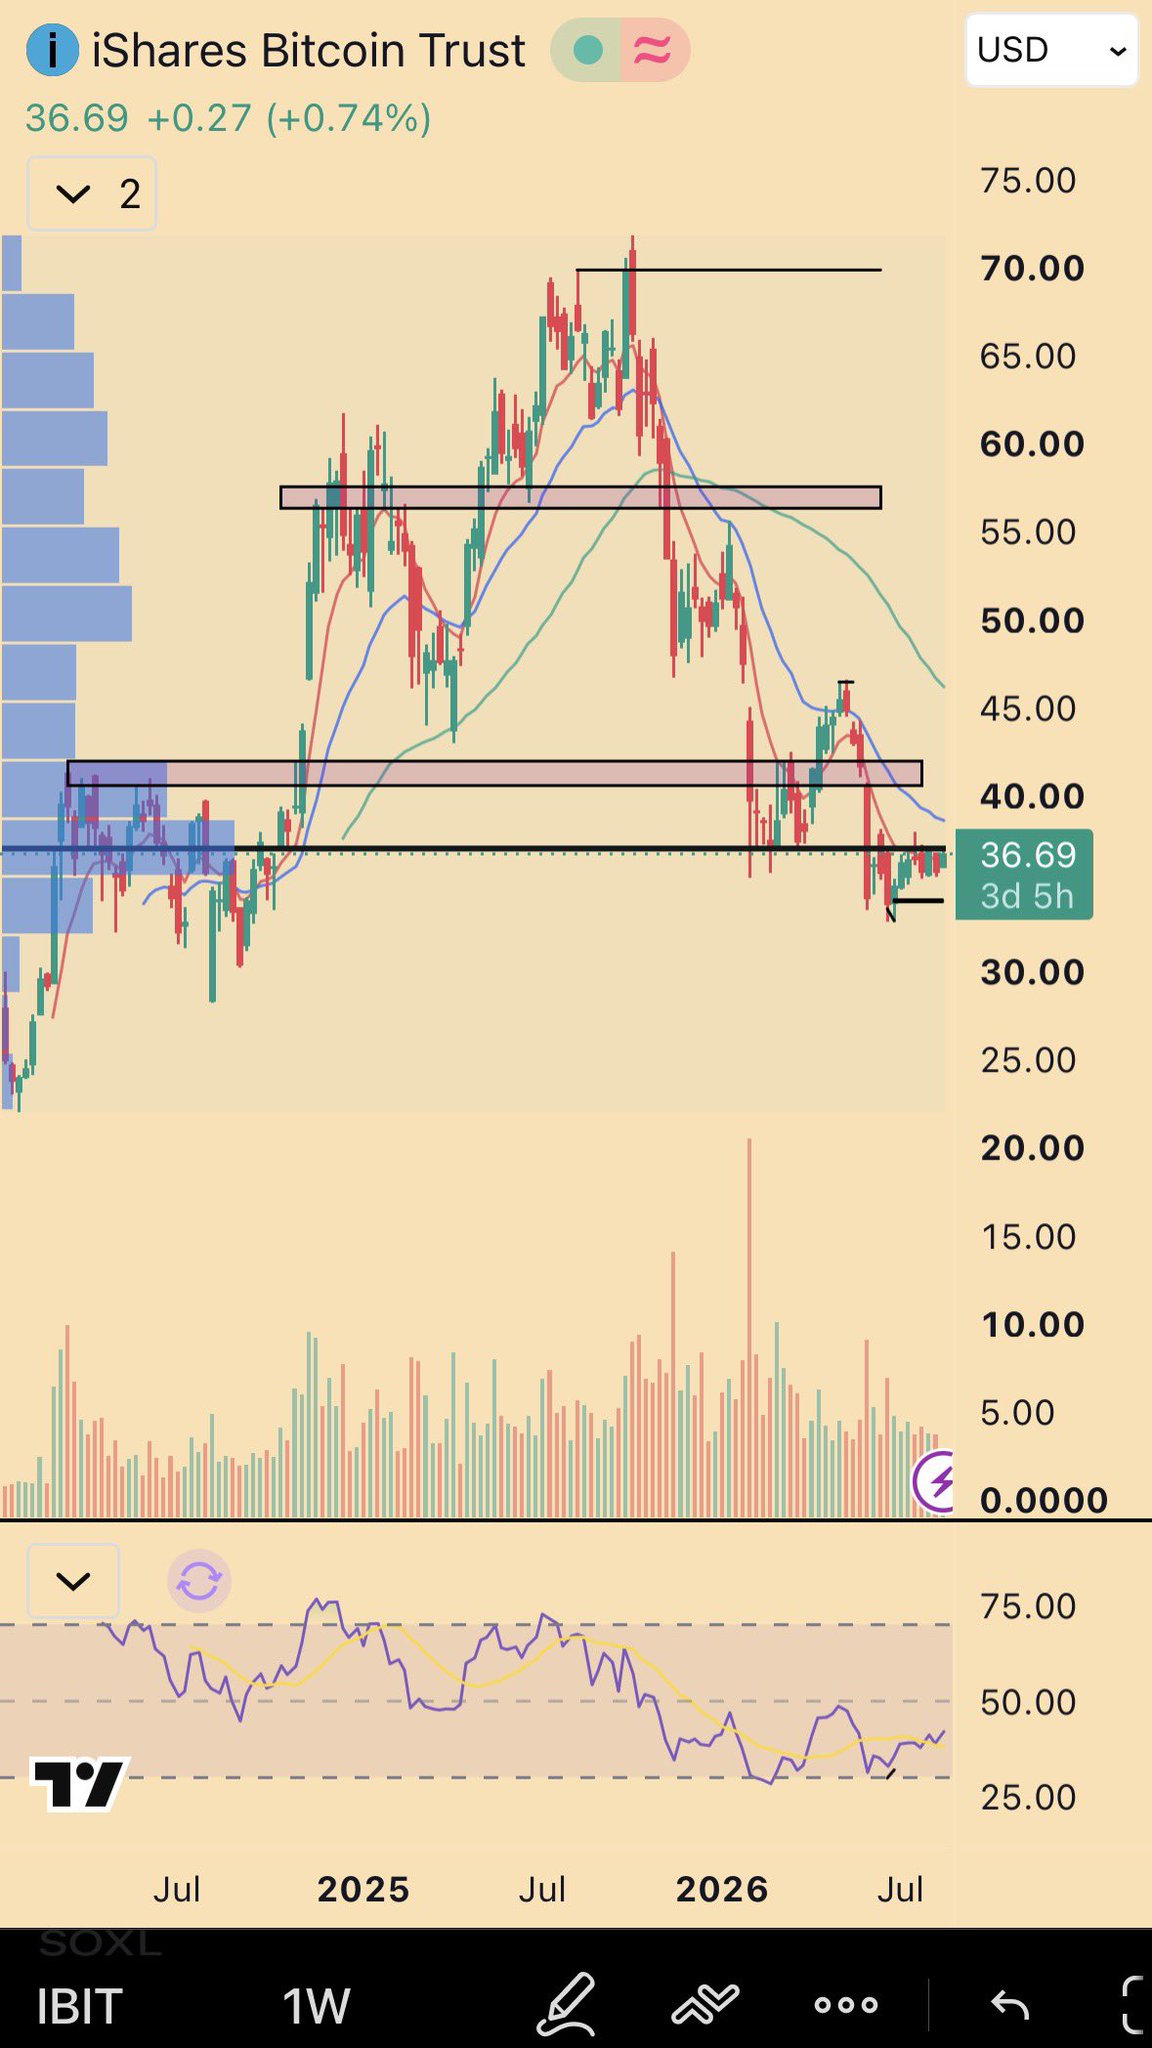
IBIT weekly — the 66k confluence: below it on a weekly close, the lower level is the expected run
The companion IBIT weekly chart carries the level that has governed his framing since August 14: "My thought process is pretty simple: as long as we're below 66k (also happens to be lifetime IBIT POC) on a weekly closing basis, you should expect a run at the lower level." The confluence — the weekly close structure coinciding with the ETF's lifetime prior-overcome zone — means the squeeze moves of the last two days get no credibility in his framework while the close holds under 66k.
His Book & Positions
New disclosure: Oct 30-dated SPX puts accumulated "all" around the top of the target box (~7,800 area) — the defensive tail fill completed this week. Standing lean carried forward: below-66k BTC/IBIT expectation (the lifetime IBIT POC) on a weekly-closing basis — short-squeeze euphoria gets no upgrade while price holds under that level.
Macro & Markets
Expiration-week mechanics front and center: price walking into the daily trend during vixpiration is, in his words, a setup for "some fuckery for the remainder of the week." The telling detail is direction — indices sold hard "despite muh heightened opex flows," i.e. the usual gamma support never materialized, so the puts accumulation is a hedge against continued weakness rather than a fade of a pin. No new gold or breadth calls in this window; yesterday's gold/SPX divergence question is left hanging.