$BTC: Below 66k, Expect a Run at the Lower Level
Mandelbrot cuts through the noise — the weekly close is the whole thesis
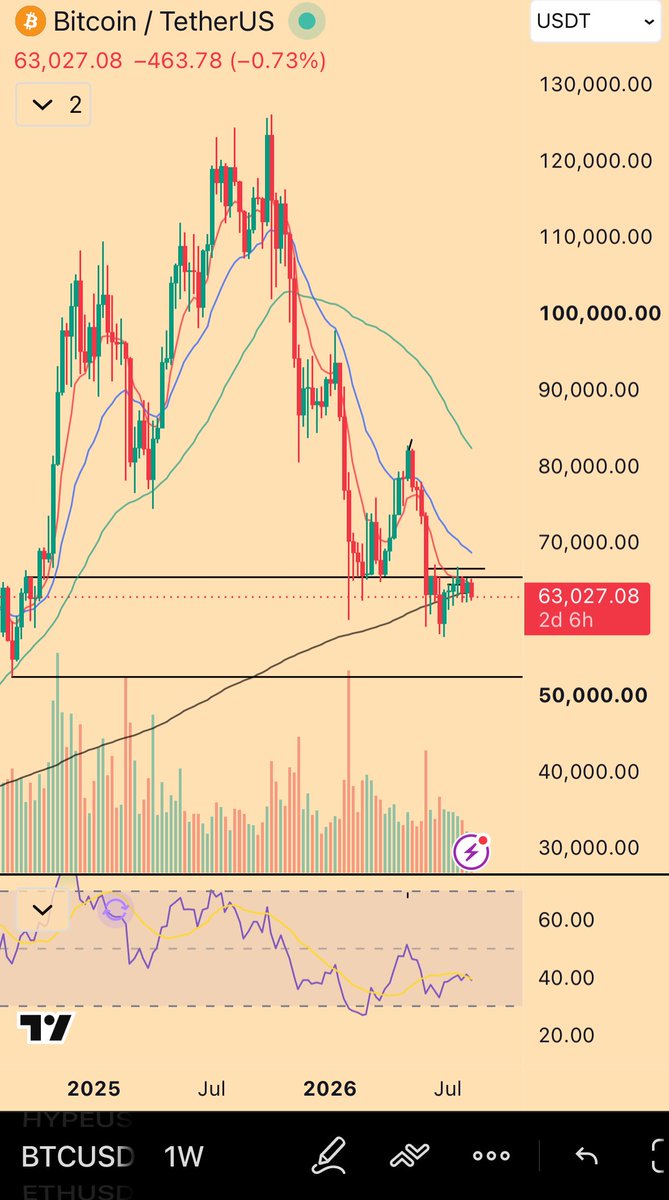
$BTC weekly with 66k (lifetime IBIT POC) as the line in the sand
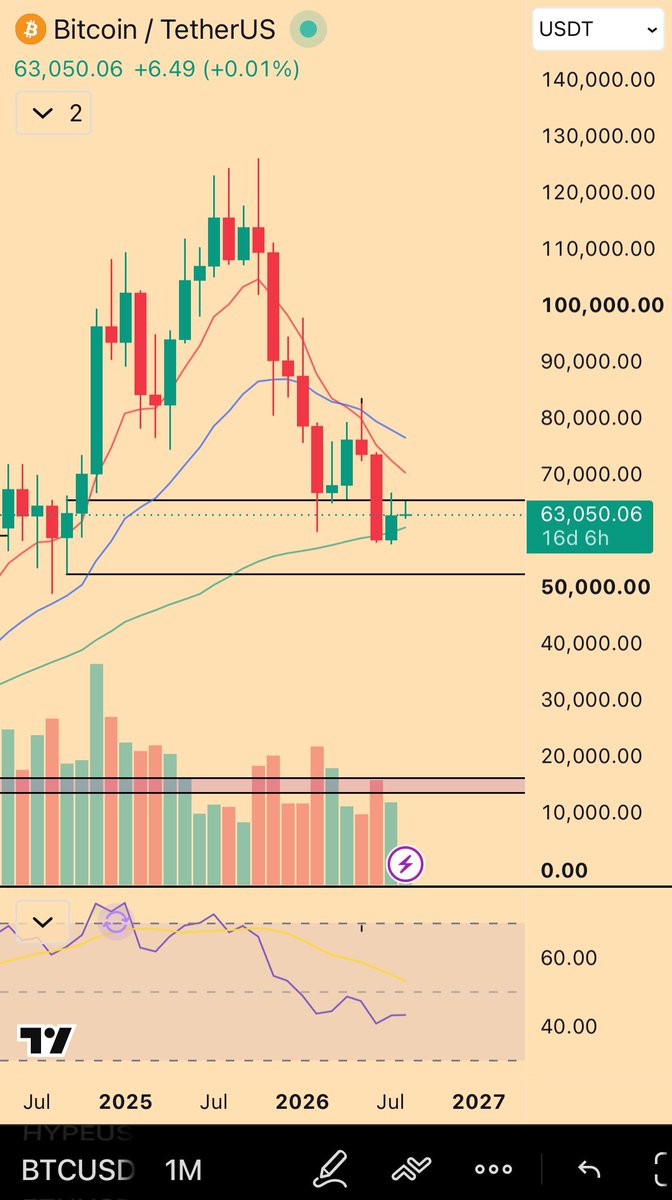
The day's most-viewed post (11k impressions, 89 likes) framed the crypto debate as a pick between two legends' setups — 'BTC Jones' versus 'HYPE Druck.' A tongue-in-cheek jab at the parade of CT accounts trying to force the bull case, with the charts left to make the argument.
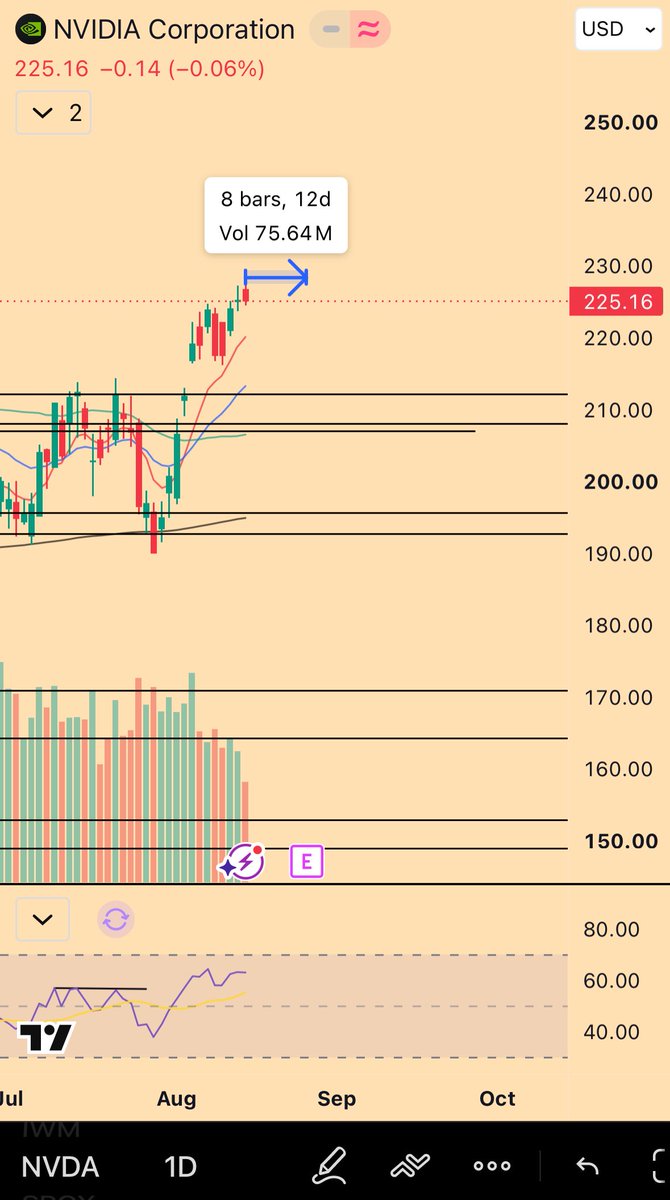
Nvidia grinding higher into its print. Mandelbrot flags the pre-earnings ramp with a raised eyebrow — the classic run-it-up-before-the-number pattern, and a chart that has to be respected until it isn't.
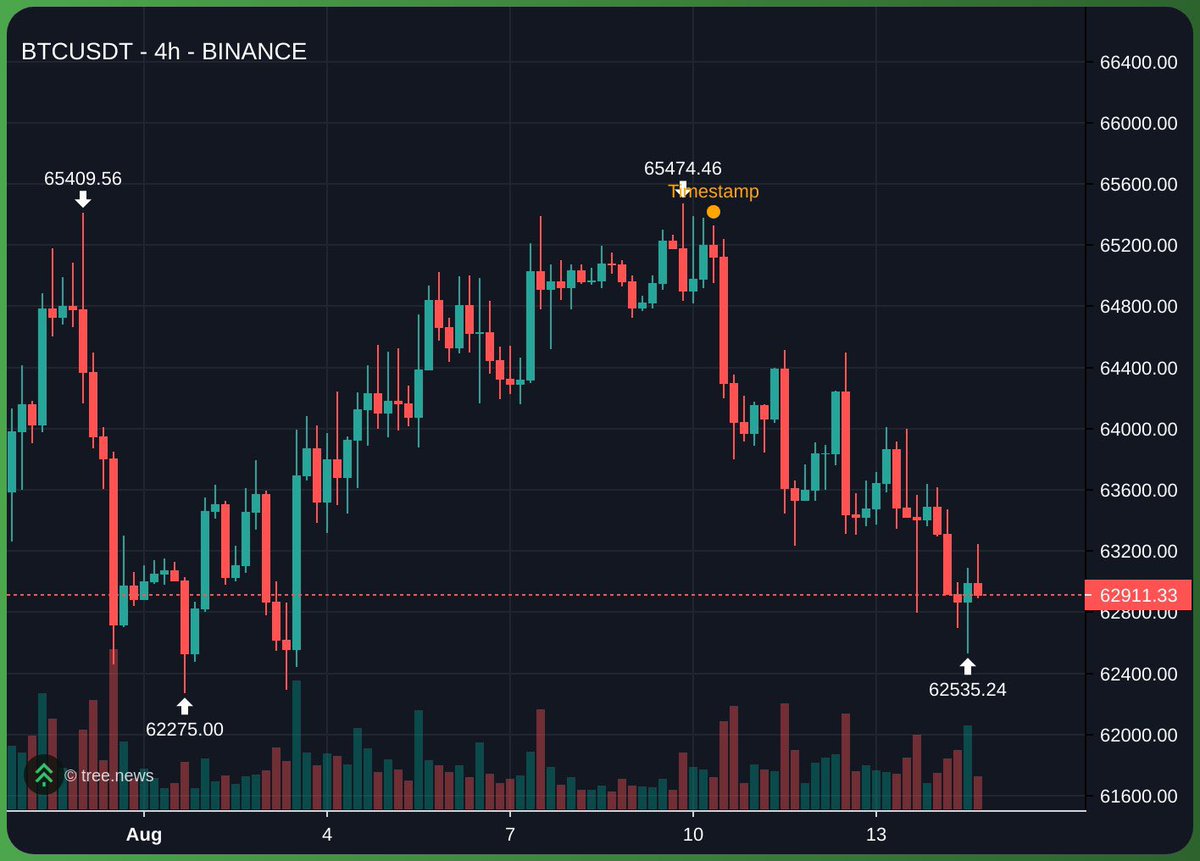
The recurring refrain, and a chart to match: drawing bullish conclusions at resistance hasn't paid for the past 10 months. This simply is not a 'buy resistance' type of tape, and Mandelbrot keeps hammering the point until price proves otherwise.
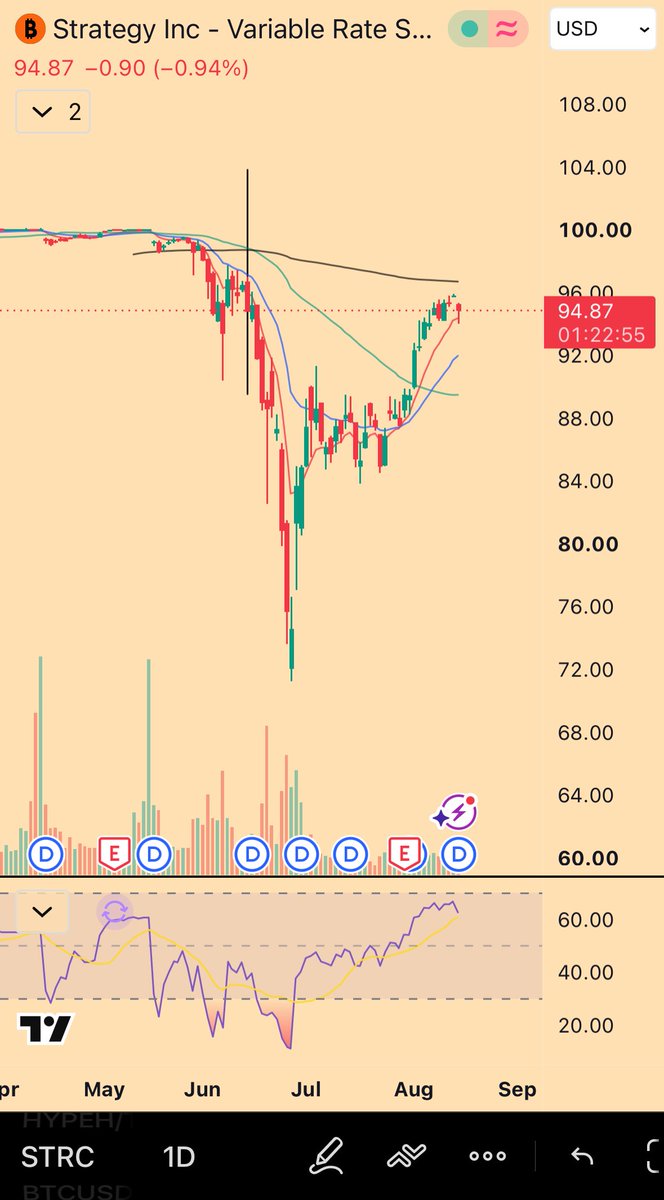
The 'Greatest Financial Engineer's' yield token rebounded but is showing fatigue: $80 buyers aren't sticking around for the last $5. A rebound that's slowing down right where it needs to accelerate.
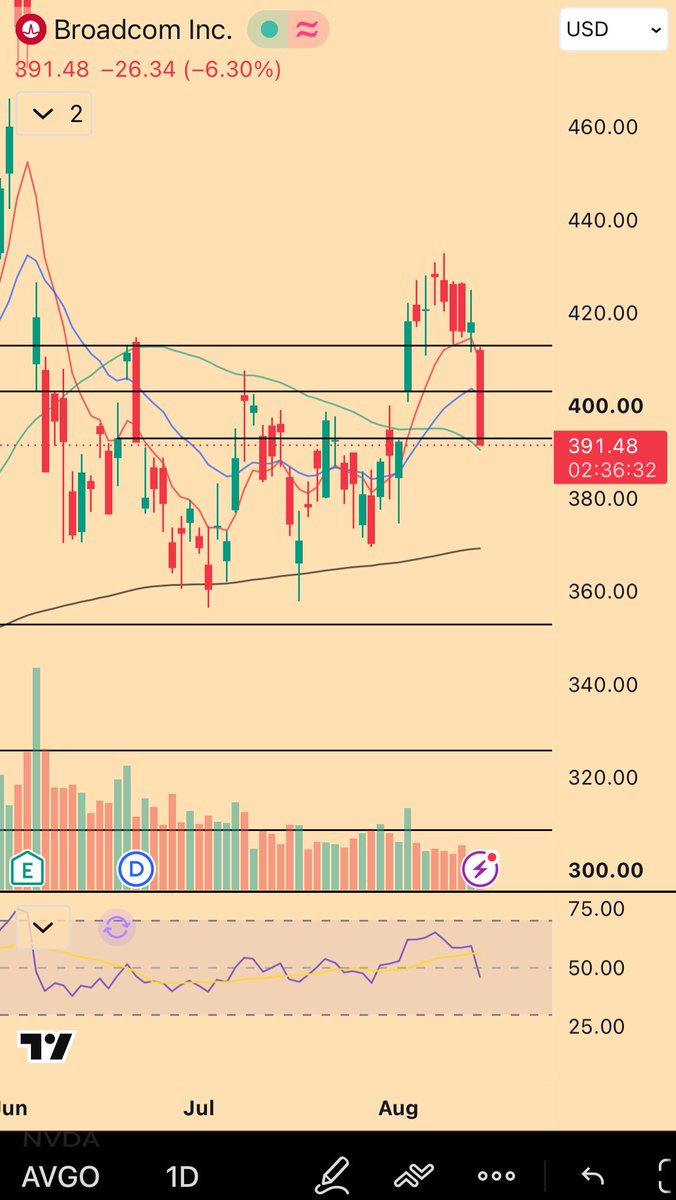
A paired look at Broadcom and Nvidia — Mandelbrot teases a 'sneak peak' of what the semis leadership may be signaling. Big-cap chip charts still doing the heavy lifting for the index.
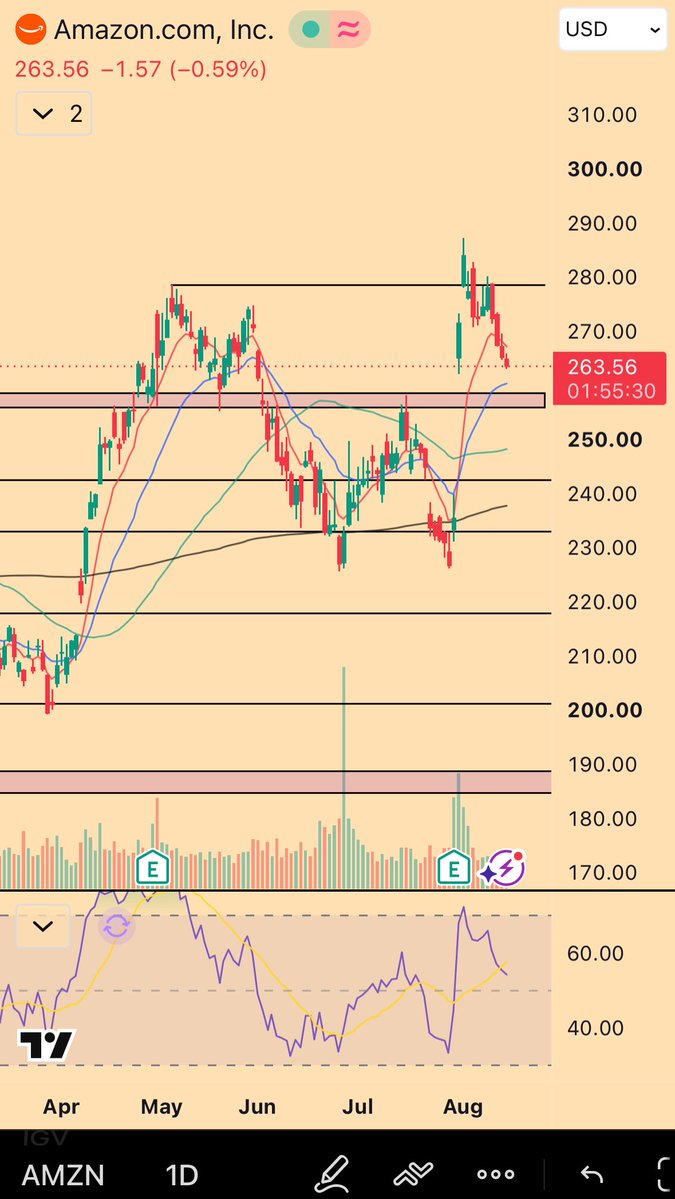
Amazon under pressure with the reminder that 'Jeff only has another $240B of stock to sell.' The insider-supply overhang framed as a headwind — not the time for Bezos, and not the chart you want to buy.
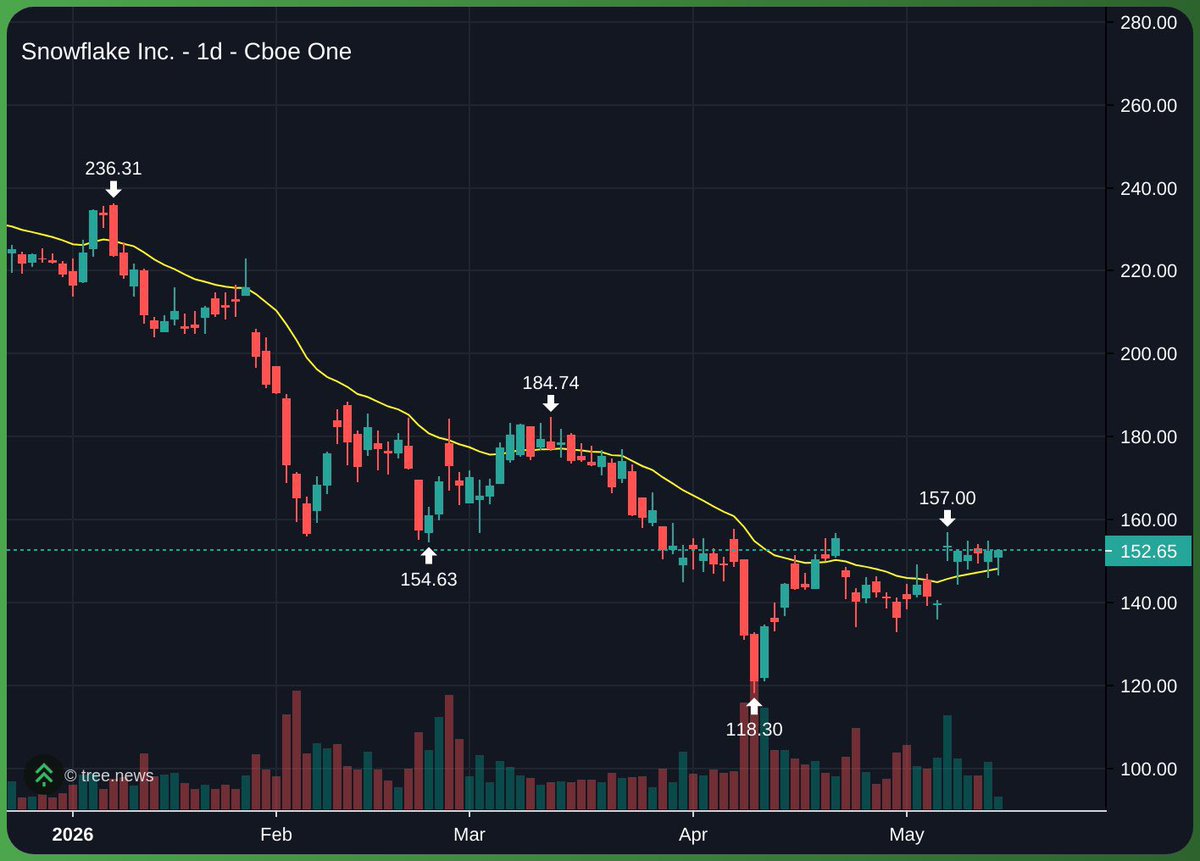
Snowflake earns a one-word verdict: 'Cinematic.' A clean, picture-perfect chart worth putting on the wall — one of the better-looking setups in an otherwise heavy tape.
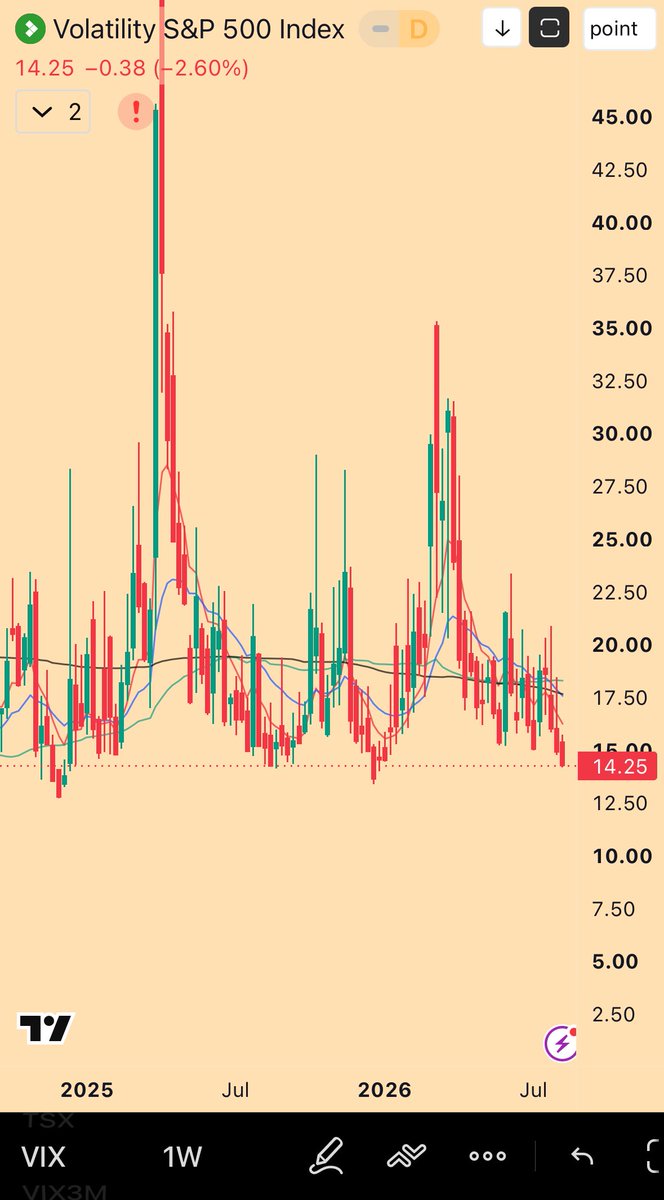
'Fitting time given both IWM and SPX vol is at Trump presidency lows.' With realized and implied compressed to the floor, the question Mandelbrot leaves hanging is whether it should be — a cheap-hedge setup dressed as complacency. Nasdaq vol he's less excited about, at least on a percentile basis.