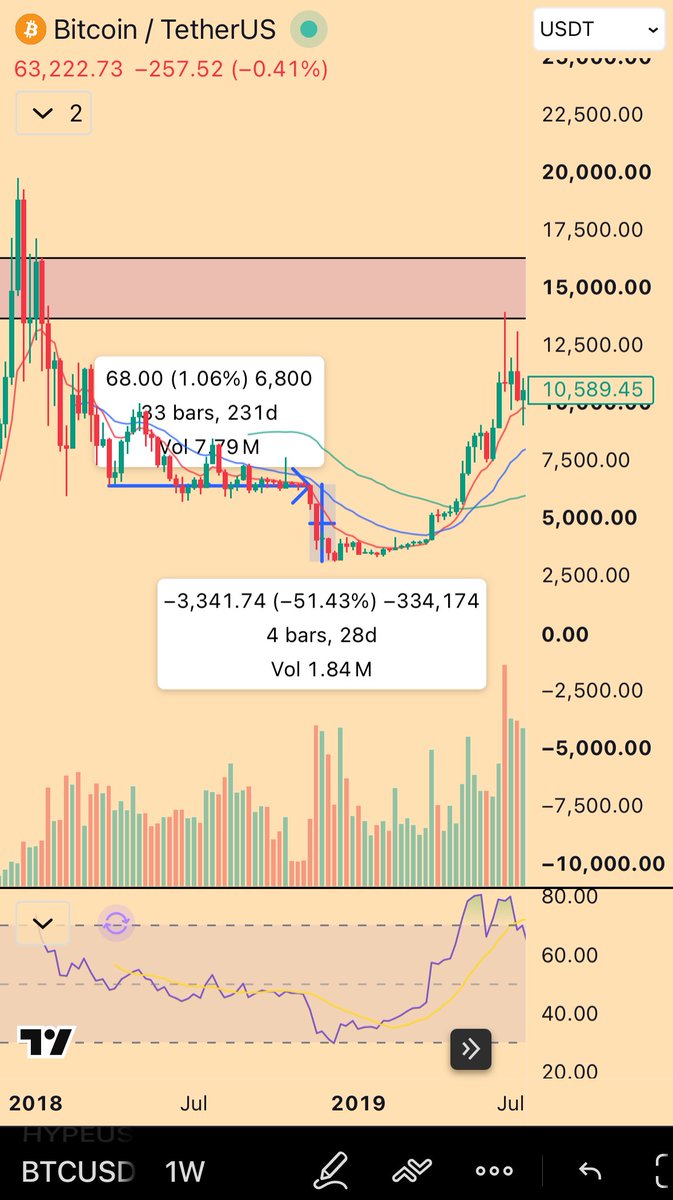
$BTC — "Flat-line into 2H Sept, capitulation in October, then the echo bubble"
The 4-yr cycle bottom arrives right on schedule — 2018 style: "(Just remove a 0) 60k = 6k"
BTC long-term — the cycle view: flat-line into 2H Sept, a final capitulatory move into the October 4-yr cycle bottom, then the echo bubble, 2018 style
Mandelbrot's biggest call of the day is the calendar itself: BTC flat-lines into the second half of September, then prints a final capitulatory move "right in line with the expected 4-yr cycle bottom in October" — and then comes the echo bubble, "2018 style." The follow-up strips the comparison to arithmetic: "(Just remove a 0) 60k = 6k," mapping this cycle's 60k directly onto the 6k of the 2018 playbook. The flat-line question — "wyd if we continue flat-lining into 2H Sept" — is the setup he is positioning for, not a dip he fears.
$BTC — "2018… (Just remove a 0) 60k = 6k"
The 2018 comparison strip — "60k = 6k," just remove a 0
The comparison strip that made the rounds: BTC's current structure mapped onto the 2018 bear, with the scale difference spelled out — 60k today is the 6k of last cycle. The overlay's implication: the capitulatory bottom prints in October, then the echo bubble, same script as 2018-2019.
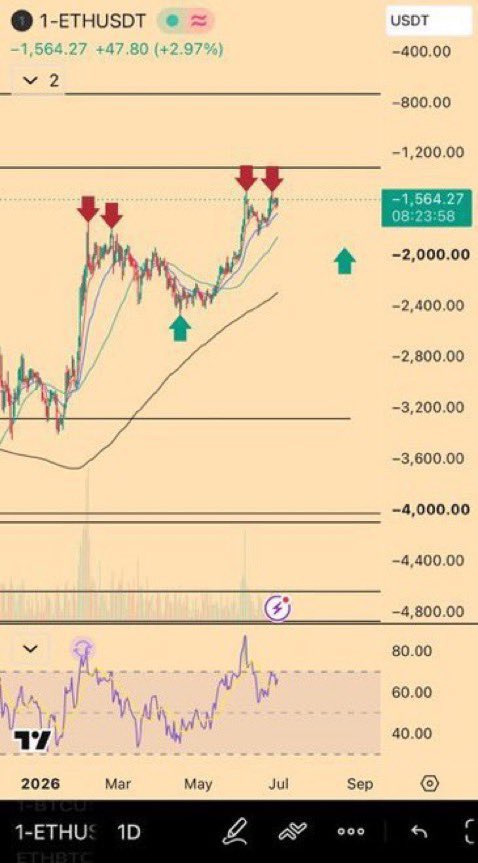
$ETH — "About 10 more days of this max and this asset will pick a direction"
ETH long-term — ~$1.56k and range-bound; "about 10 more days of this max" before it picks a direction
ETH is still coiled — "Hopefully donalt buying doesn't fk with my plan," he half-warns — but the call is patience: roughly 10 more days of the range, max, and ETH picks a direction. The charts show ETH ~$1.56k sitting in the low end of the band that has defined the last stretch, coiling toward the resolution.
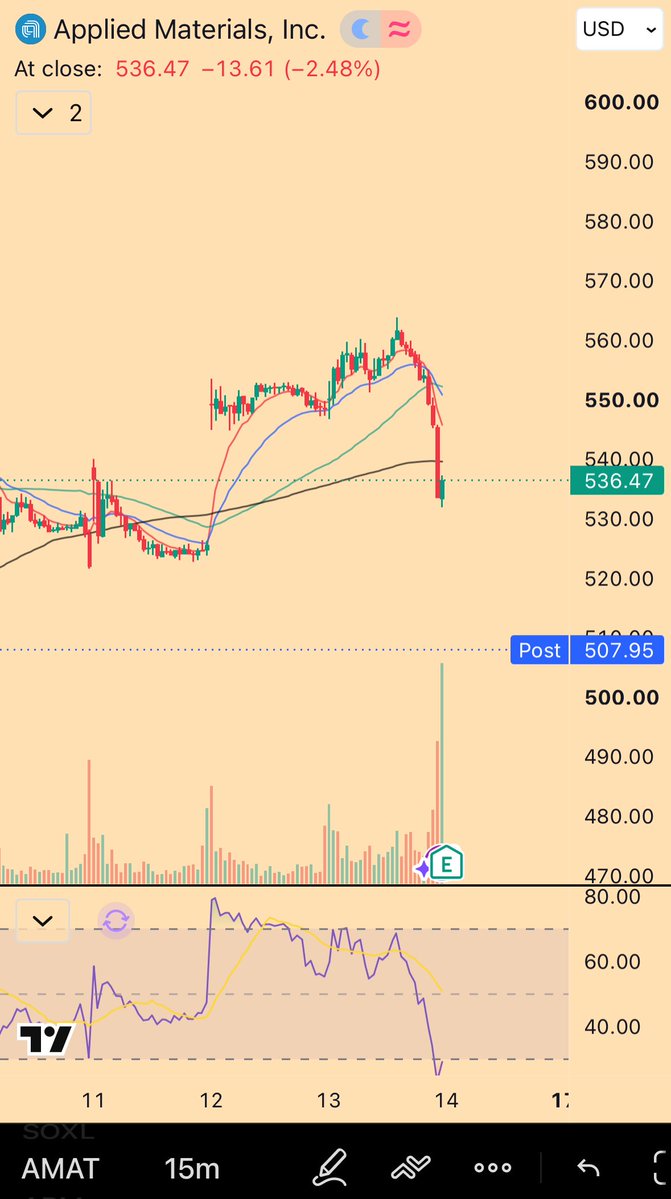
$AMAT — "Pretty blatant now. I'm not even being sarcastic this time"
AMAT at close 536.47 (-2.48%) — the afternoon tape read the earnings before the print
Applied Materials closed -2.48% at 536.47 into its print while Lam Research added +3.34% to 337.05 and ASML +2.09% to 1,847.93 — and for Mandelbrot the afternoon tape had already said so. "I don't remember a time where you could just look at the tape during the afternoon and know exactly how earnings were going to go lol." The read: semis bifurcating on the release, priced before it happened.
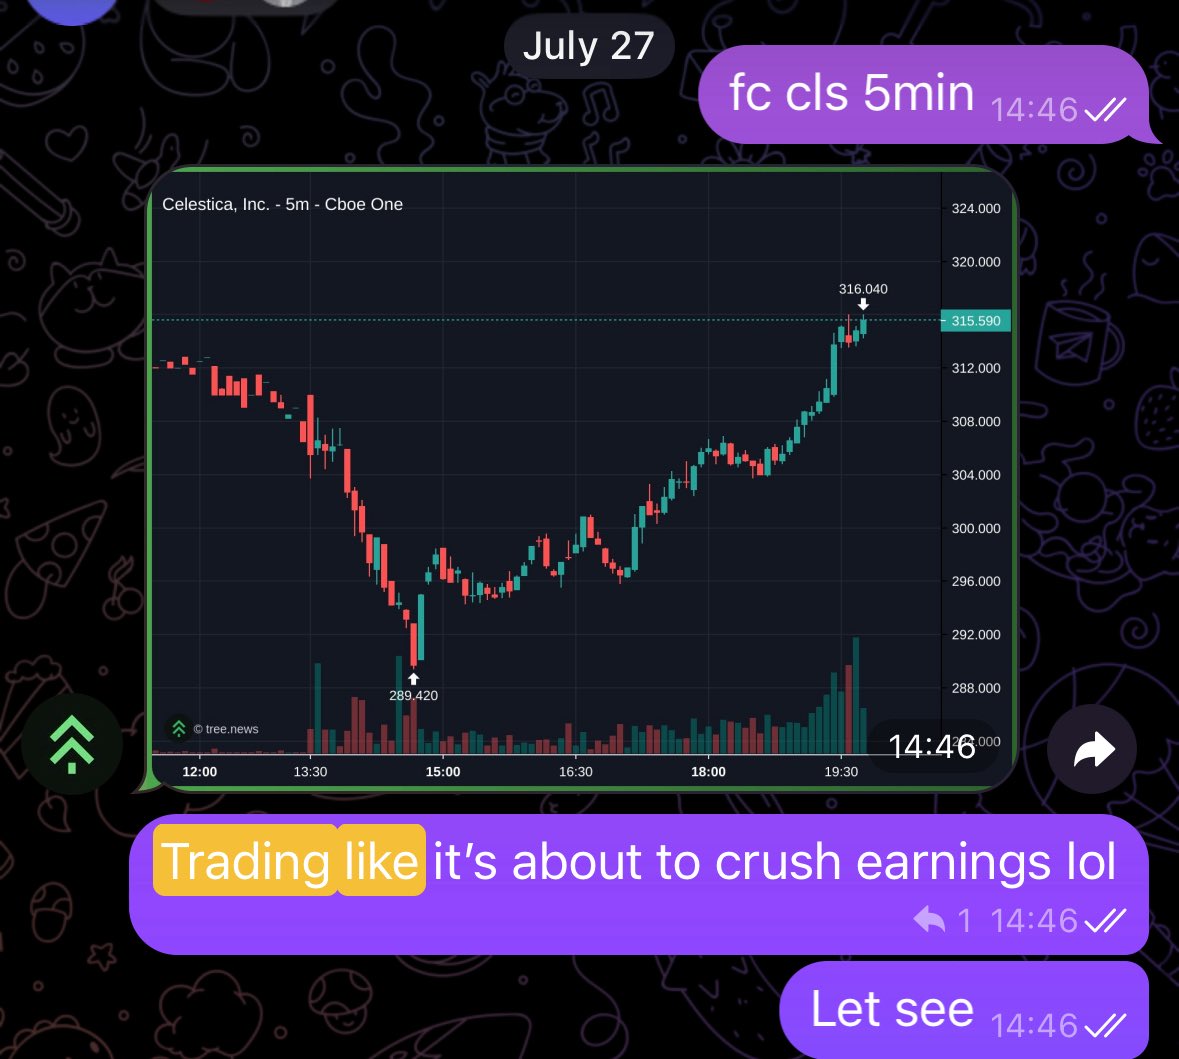
"It's not a random walk down Wall Street anymore"
5m Cboe tape — CLS ~316, TER ~322, AVGO ~405 — the afternoon tape telegraphing how earnings go
A closing four-name tape check — CLS, TER, AVGO, GOOG — generalizes the AMAT observation. "Of course there are instances where the market gets it wrong," he concedes, "but it does feel like it's not a random walk down Wall Street anymore." The 5-minute charts: the tape telegraphing the reaction before the release.
$SOXX $SOXL — "Are you watching closely?"
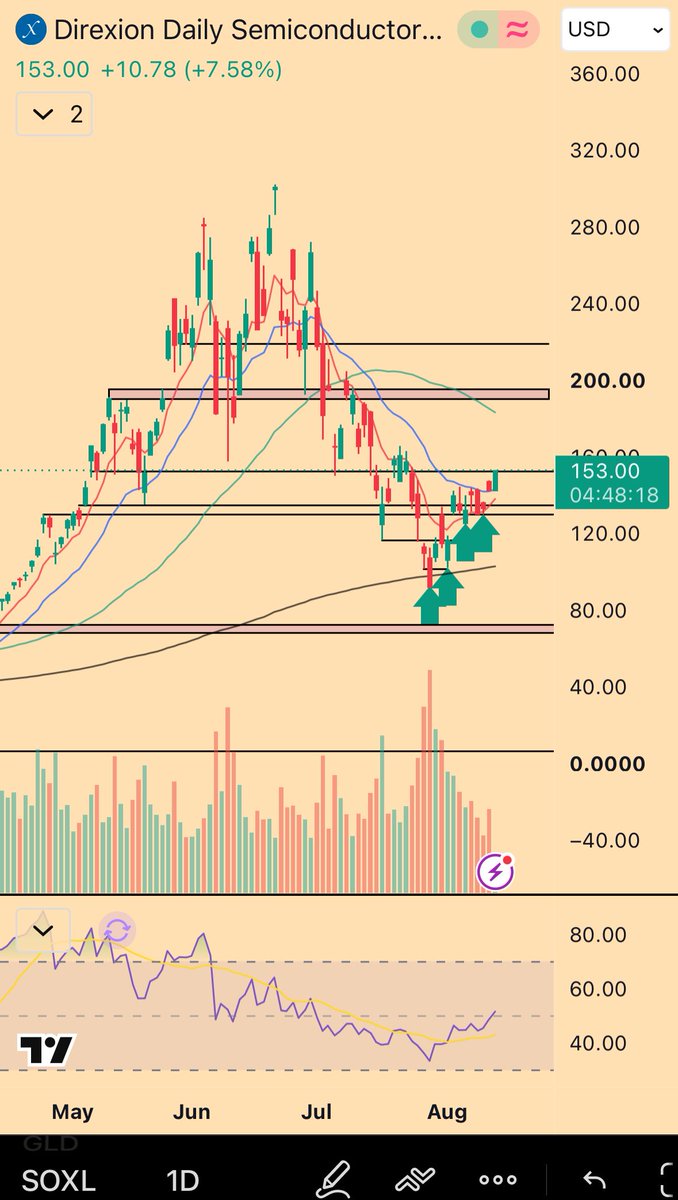
SOXL +7.58% to 153.00 — semis ripping while the NVDA/SMH ratio rolls over
The semis put on a show: SOXL +7.58% to 153.00, SOXX +2.57% to 560.64. But the pair charts carry the real signal — SOXX/MAGS +1.80% while NVDA/SMH falls -1.71%: breadth inside the complex with NVDA dominance rolling over. "Are you watching closely?" — the follow-through on yesterday's "super important final two days of the week" call.
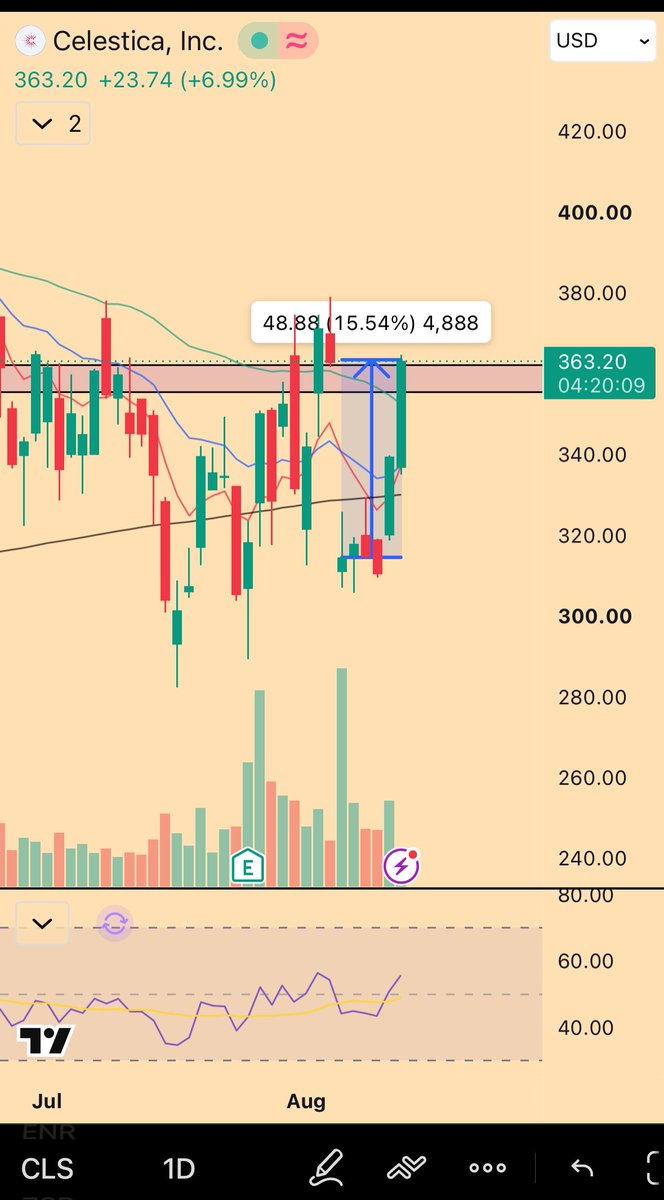
$CLS — "Dilution gap filled. Thanks for playing"
CLS +6.99% to 363.20 — the dilution gap filled
Celestica filled the dilution gap and kept going — +6.99% to 363.20. The terse close-out of the trade he'd re-armed the day before ("Fixed it"): the gap hanging over the name is gone, and the tape said thanks for playing.
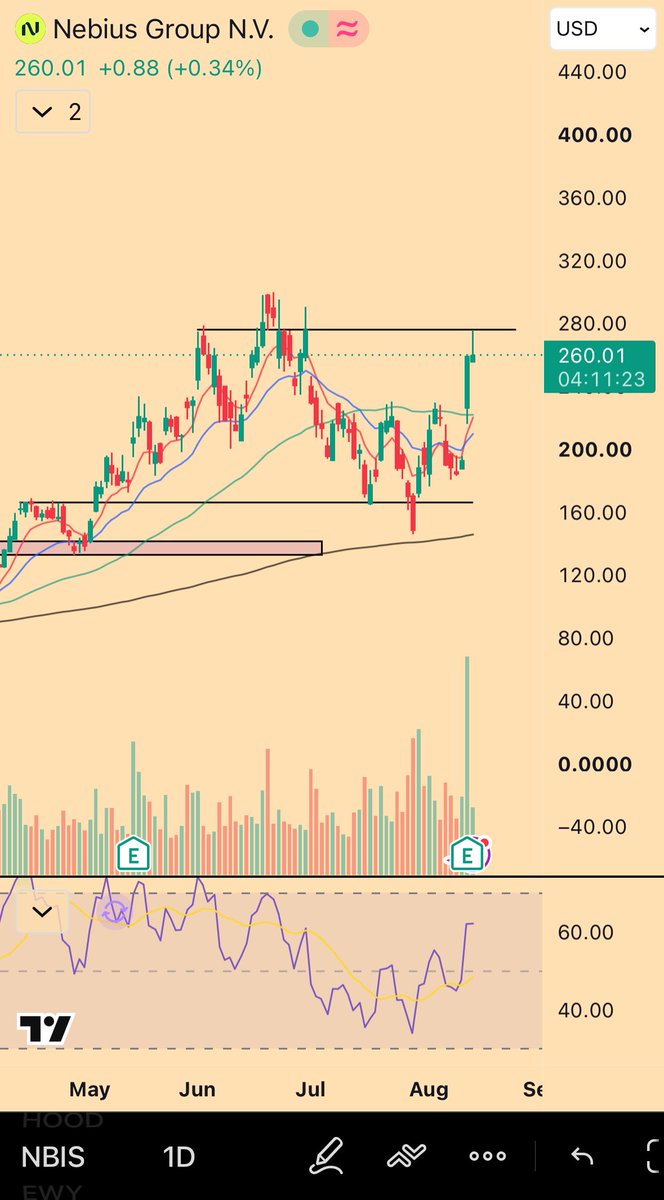
$NBIS — "Guaranteed Right Shoulder"
NBIS 260.01 — the right shoulder of the H&S, "guaranteed"
Nebius at 260.01 (+0.34%) is carving the right shoulder of a head-and-shoulders top — so guaranteed in his telling that the pattern name is the entire thesis. Left shoulder and head are in place on the chart; the right shoulder is the part being drawn now.
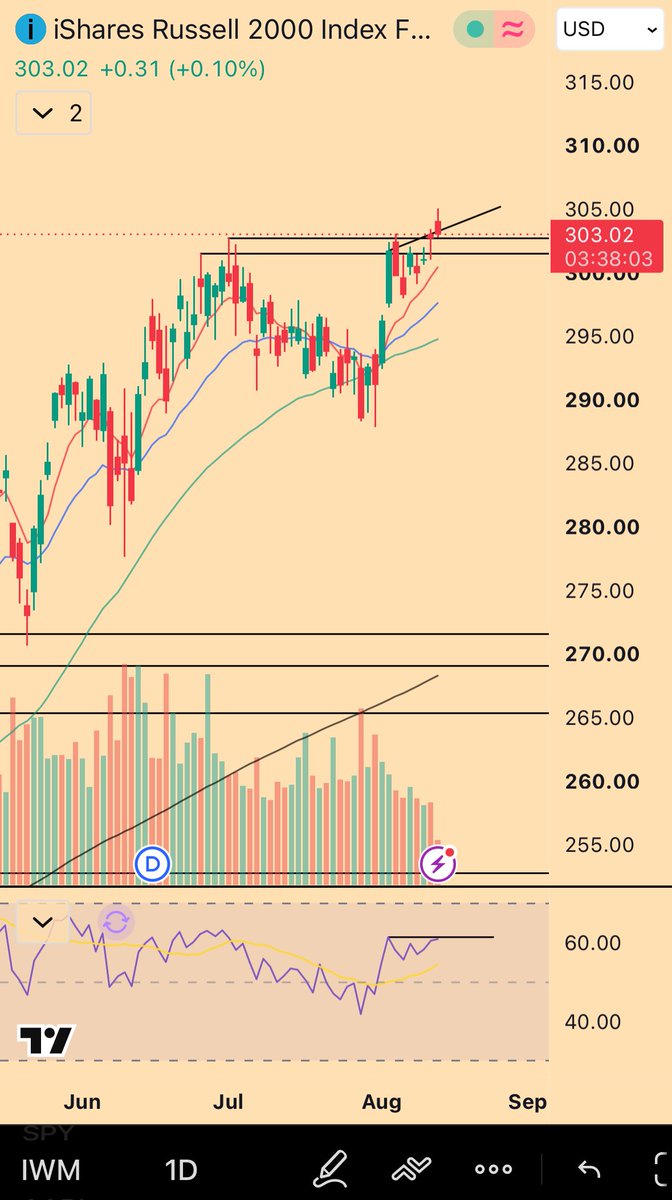
$IWM — "The irony of small caps topping on the day of 'peak hawkishness'"
IWM 303.02 (+0.10%) — topping on the day of "peak hawkishness"
Russell 2000 at 303.02 (+0.10%) — flat on a day the tape tagged as peak hawkishness, and that flatness reads as a top to him. The irony: small caps were supposed to be the dovish-trade beneficiary, yet they stall exactly when the hawkish narrative peaks.
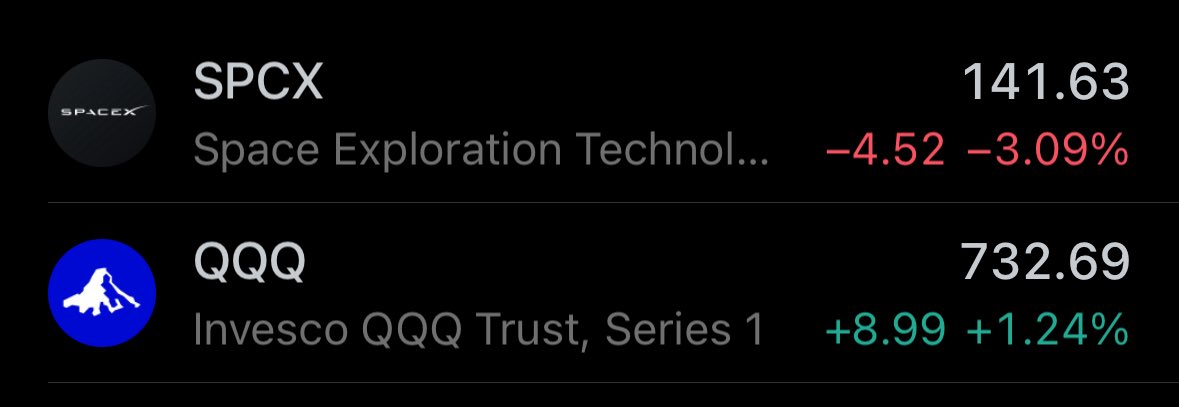
SPCX vs QQQ — "Fascinating behavior"
SPCX 141.63 (-3.09%) vs QQQ 732.69 (+1.24%) — "Fascinating behavior"
The self-quote with no caption needed: SpaceX at 141.63 (-3.09%) giving back a slice of the +40% run while QQQ adds +1.24% to 732.69. A day after "they are selling their Tesla for SpaceX," the rotation at least pauses — and the chart he flags with "Fascinating behavior" shows the two diverging.
His Book & Positions
ES/S&P: distribution watch — ES 7,828 (+0.74%) "SFP'ing the high at the exact same time of the distribution," per the 2021-similarity fractal; a follower's read (lack of volume on the break toward 7800, clean rejection so far) matches his own. BTC: "Would you long this?" he asks at ~$63.5k — the flat-line question; the plan is the October bottom, not the current chop. Tail-hedge playbook intact: SPX/IWM vol "low enough to start buying" (from yesterday), nothing expected through August opex.
Macro & Markets
Bear-market status: Day 309 and "we have yet to experience a true circle 2 yet…" — a second leg is possible, "doesn't mean it has to happen ofc," but "this bear market has been lite mode so far compared to all the others." The balanced tape: BTC liquidation maps show today's distributed walls from ~56.7k to ~72.2k vs May's single "fattest pitch in history in the 80s" — "this iteration of a *presumed* bear market rally is not like the last." Calendar: nothing through August opex; Jackson Hole at month-end is the catalyst "if Warsh acts sus despite these cold(ish) cpi prints." The bottom window is "2H Sept through 1H Oct," with the shape after it "2019 style echo bubble." And BTC only truly capitulates "if Saylor has to liquidate everything and it's done in a slow manner."