$SPCX — "They gave me my target today, so I took the money"
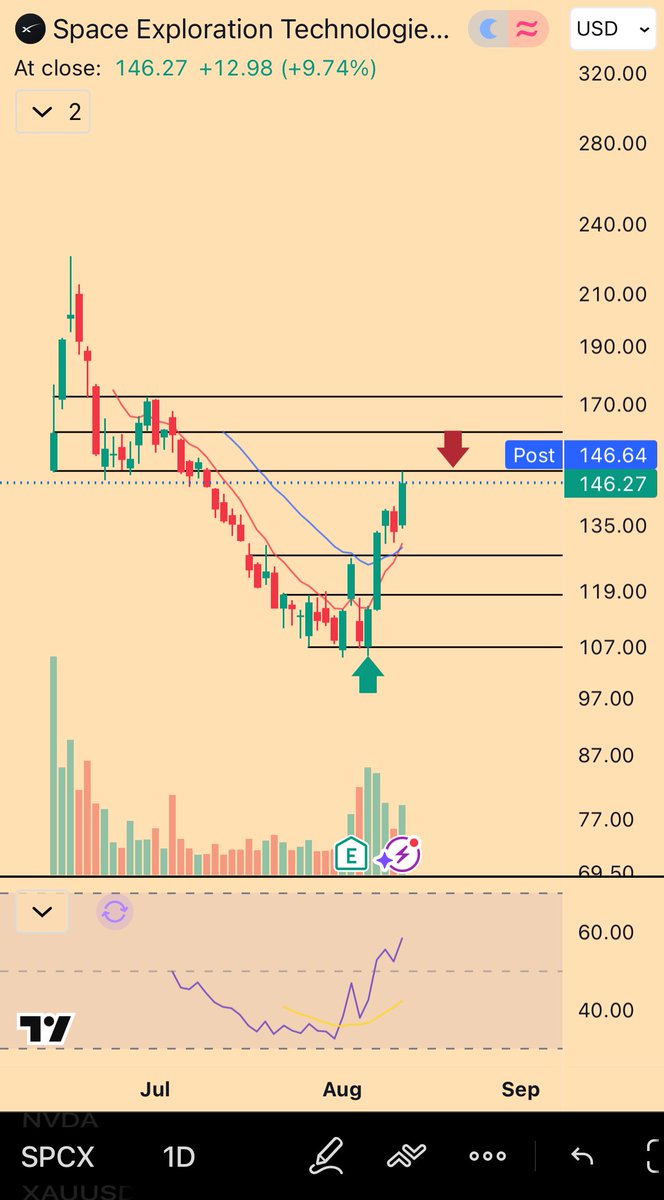
Fully out by 149.50 after a +40% run in five trading days; rebuying on a clean break of 150
SPCX daily — the observe-mode chart after the target print; he is fully out by 149.50 and watching for a clean break of 150 to re-enter
Mandelbrot's flagship SpaceX trade reached its conclusion Wednesday: after being handed his target, he flipped to "full observe mode" and is fully out by 149.50, having banked roughly +40% in five trading days. "Feels" early, he admits, but he will be rebuying on a clean break of 150 — and he notes the context: "they literally just gave the BTC echo bubble target on a similarly sized asset," comparing the move to a $92k-equivalent Bitcoin move. Earlier in the session he was already over 50% taken off, so the exit was staged, not sprung.
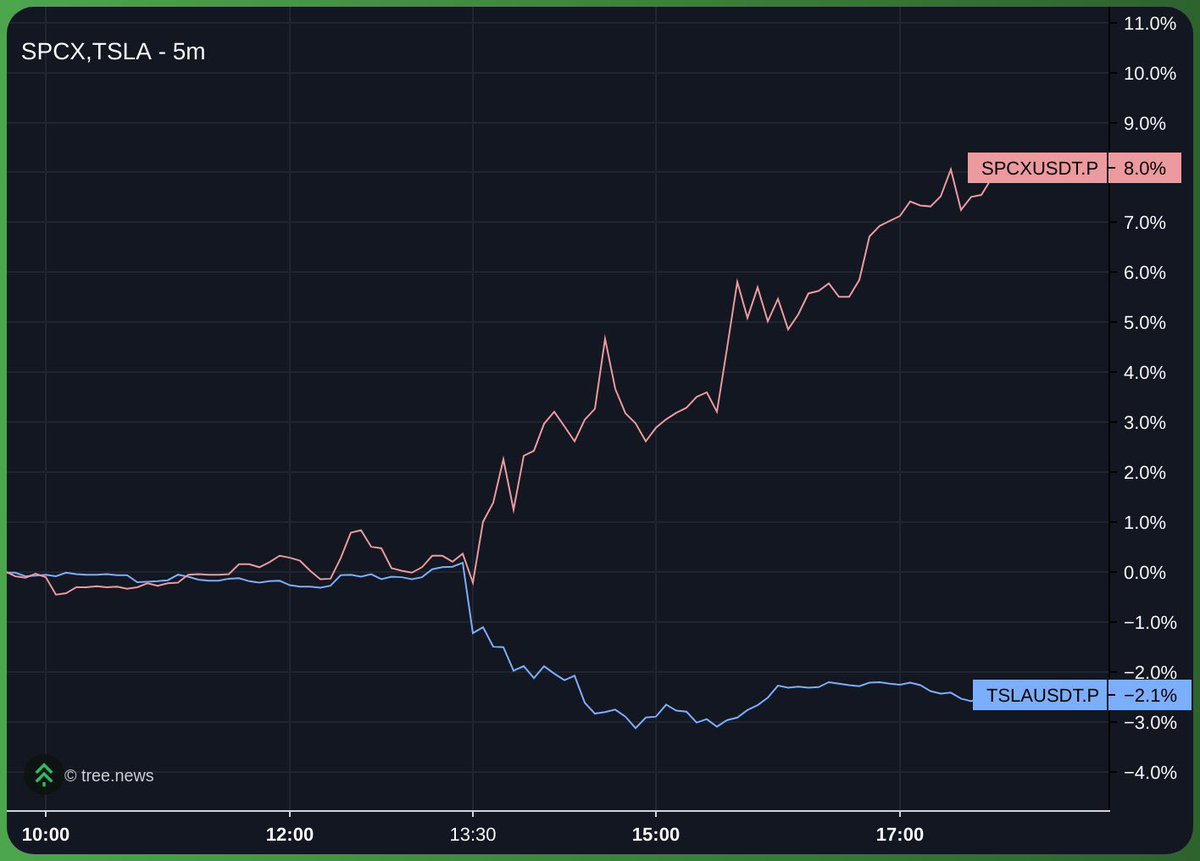
$SPCX $TSLA — "They are selling their Tesla for SpaceX"
SPCX vs TSLA — the rotation chart: selling Tesla for SpaceX
His read on the tape's favorite rotation: the marginal dollar is leaving Tesla and going into SpaceX. He frames it as the market selling TSLA to fund the SPCX chase — the chart pair showing one name funding the other's melt-up.
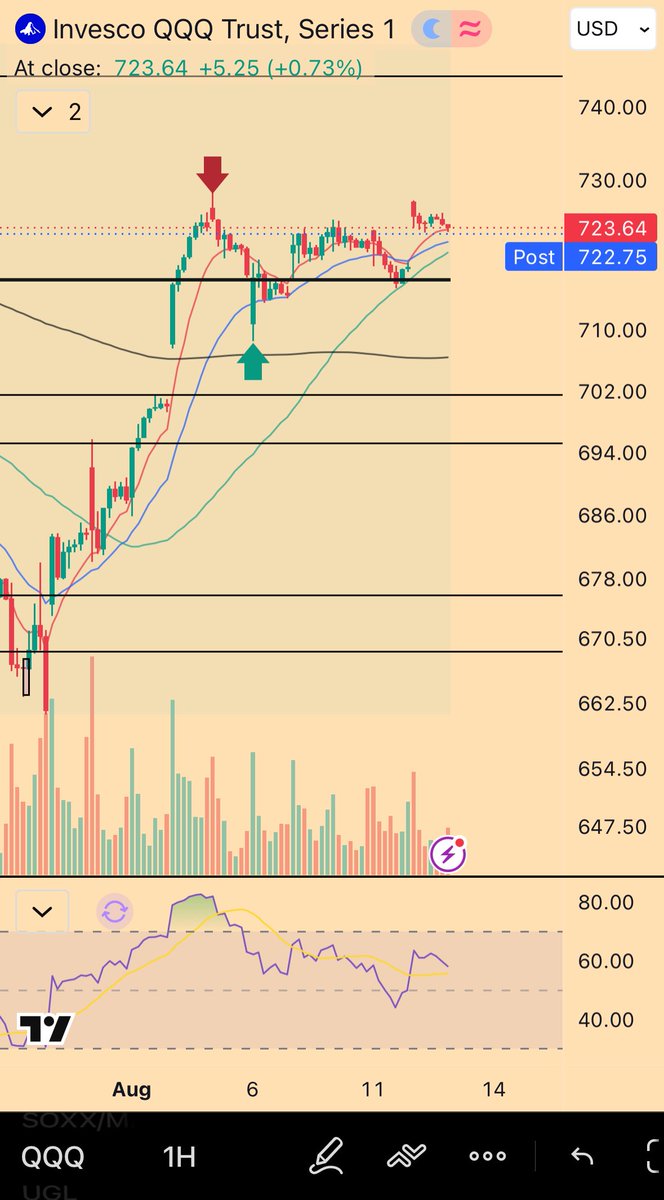
$QQQ — "So far the answer is no. Shocking"
QQQ daily with his annotations — "So far the answer is no. Shocking"
The QQQ chart gets the terse verdict of the day: the question everyone is asking — whether the Nasdaq confirms or cracks — so far answers no, and he is unsurprised. Chart attached with his levels; the call reads as QQQ refusing to give the breakdown.
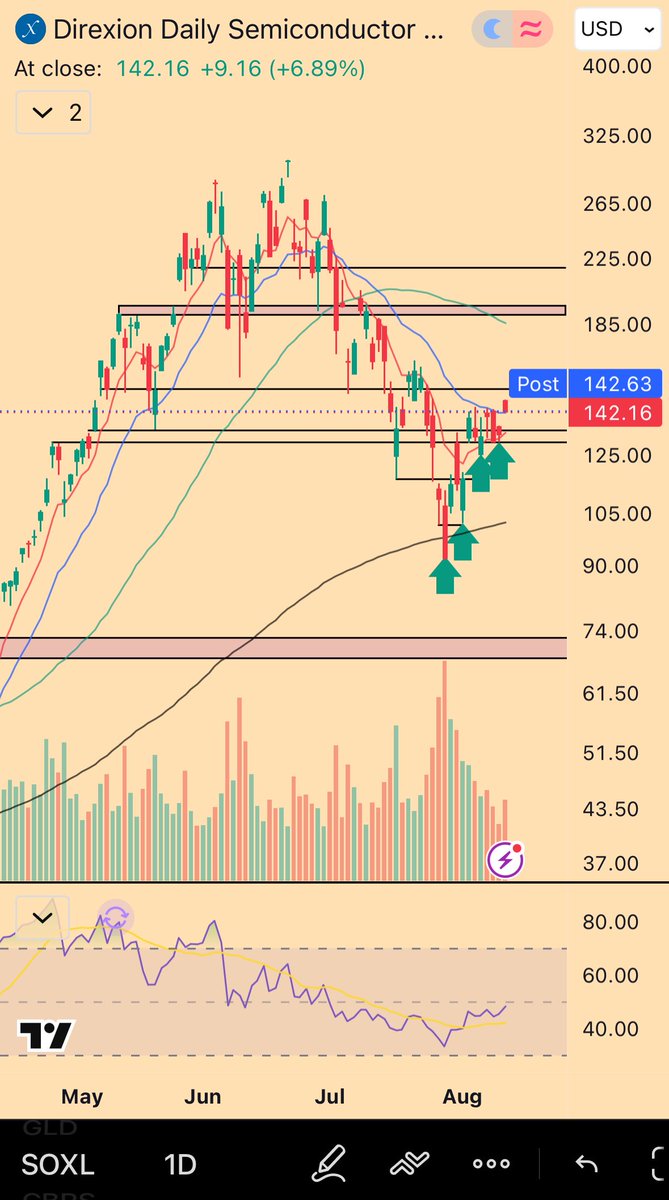
$SOXX $SOXL — "Super important final two days of the week for semis"
SOXX/SOXL — four-chart setup into the "super important final two days of the week"
He flags the last two sessions of the week as the semis decision point, posting a four-chart setup on SOXX and SOXL. The bear angle stays NVDA dominance — in a reply he clarifies a post "Mainly wrt NVDA dominance" is "a bear post." If the SOX can't hold into Friday, the semis lead the market down with them.
"Too quiet…" — waiting on the tape
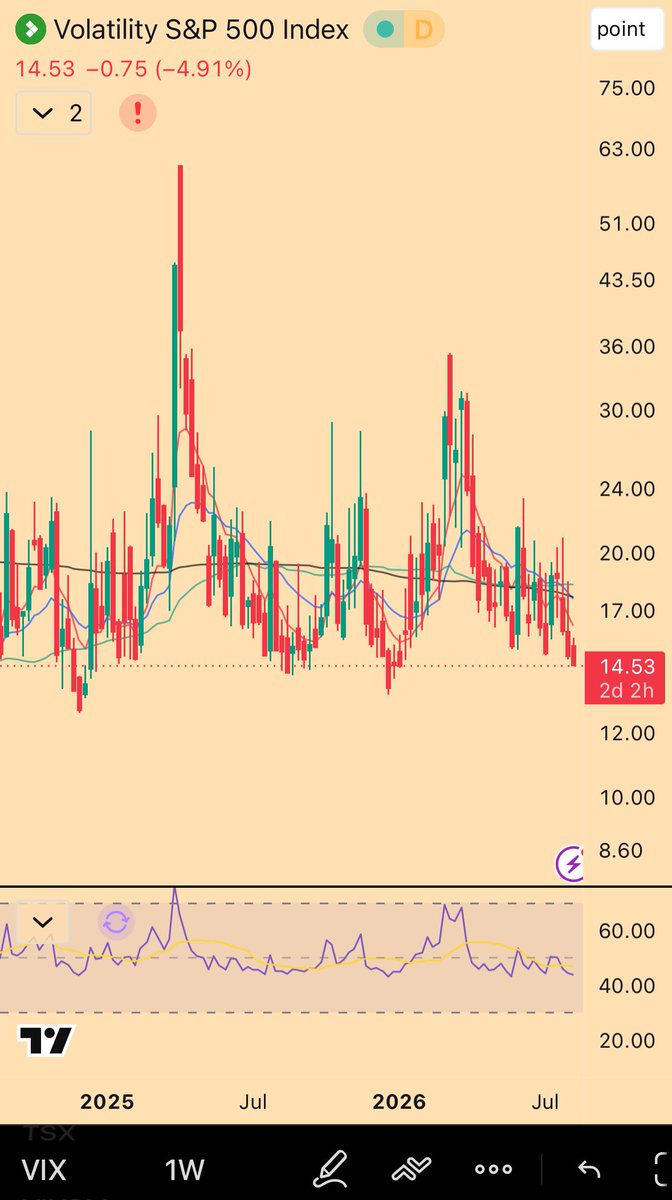
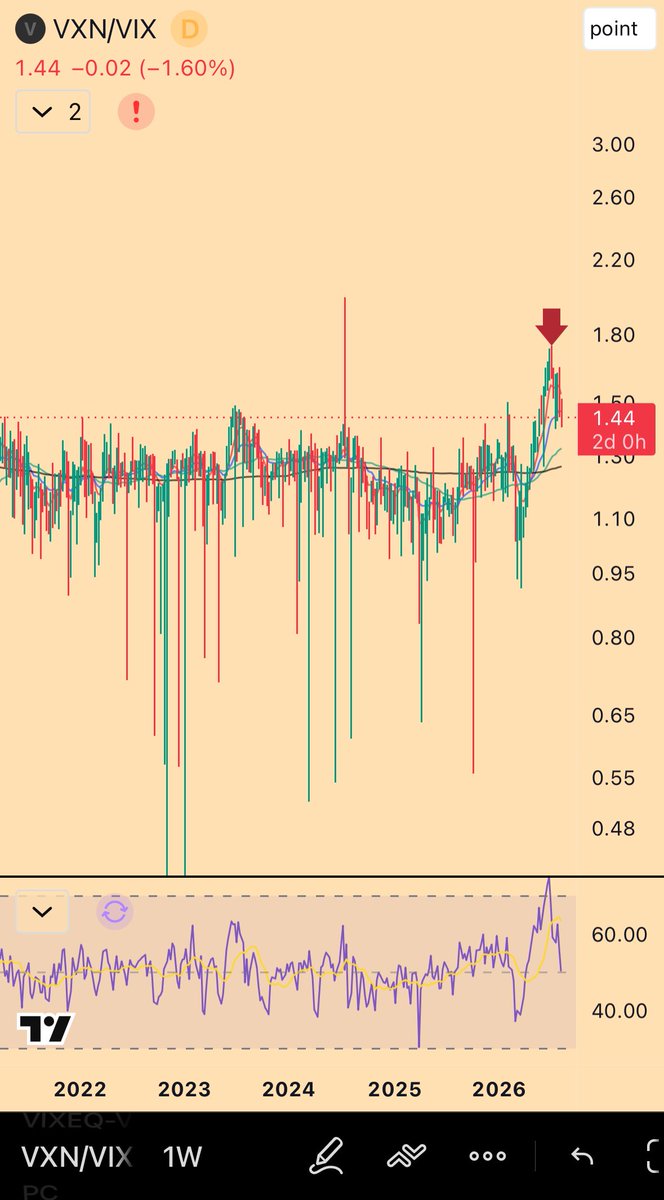
Vol/market charts — "Too quiet…"
A two-chart post with a single warning: the market is too quiet into the week's decision points. For a trader positioning for vol, silence reads as compression — the setup before the pop, not the all-clear.
Vol — "you want the vol soon given where skew is"
SPX/IWM vol + skew — "vol is low enough to start buying imo"
In a reply on positioning, he is explicit about the trade: with skew where it is, "a bit more to squeeze out relatively speaking," but SPX and IWM vol is low enough to start buying. The tail-hedge lean — long QQQ/SPX puts — stays intact as the cheap-vol window closes.
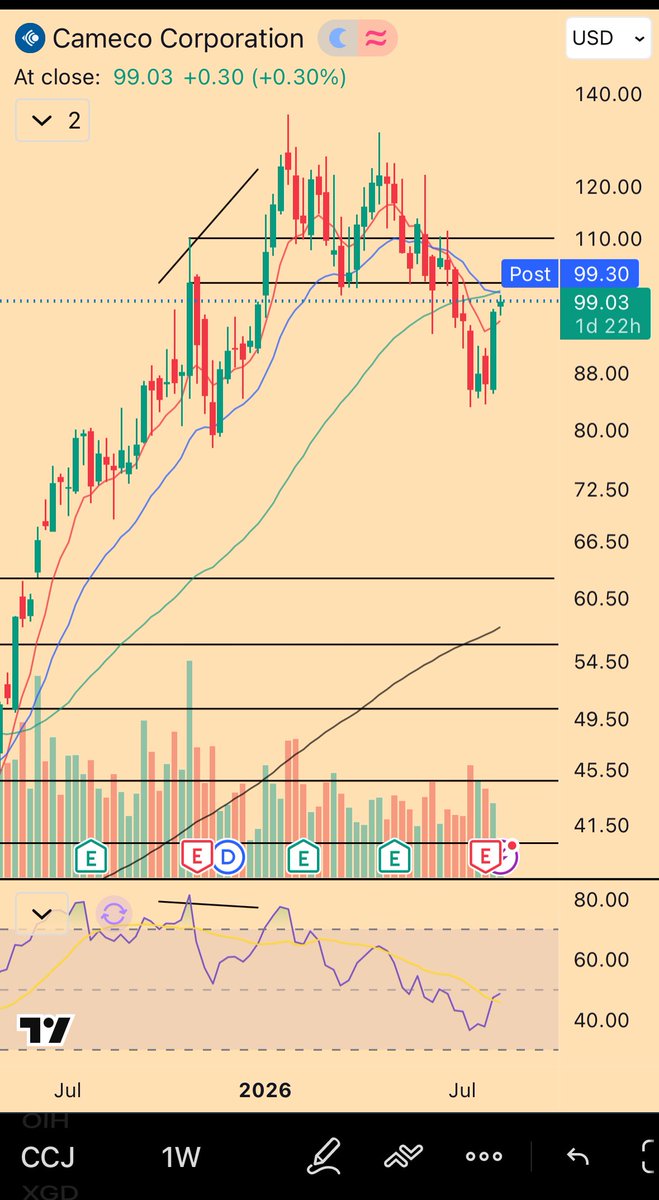
$CCJ — "Re-testing weekly trend… Binary spot here though"
CCJ weekly — trend retest after the monthly bear div played out; clear it for new highs over 6 months
Uranium name Cameco sits at the line: the monthly bear divergence has played out, RSI reset, and price is now retesting the weekly trend. "Clear this and I'd expect new highs over the next 6 months" — but he is honest it is a binary spot and he is "currently on the wrong side." In a later exchange he defends his green arrows as long entries and reminds followers this is where "you would take partials and watch the reaction."
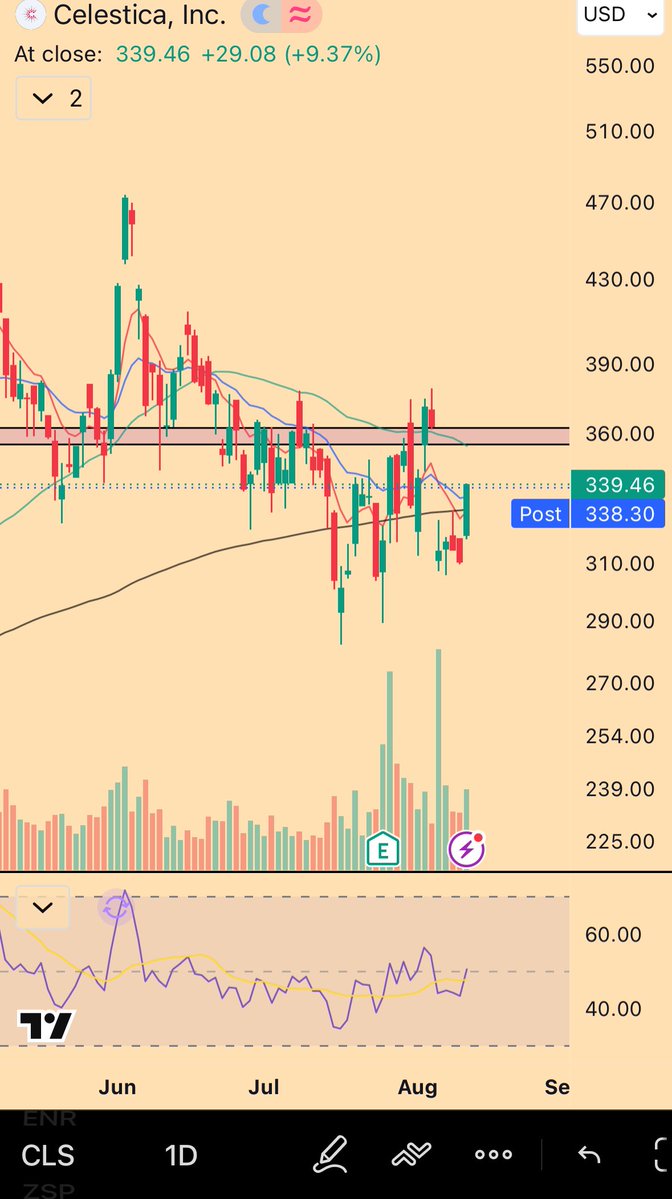
$CLS — "Fixed it"
CLS chart — "Fixed it"
Celestica gets a one-word correction post: "Fixed it." A fresh chart after a previous version — his levels redrawn, the setup re-armed.
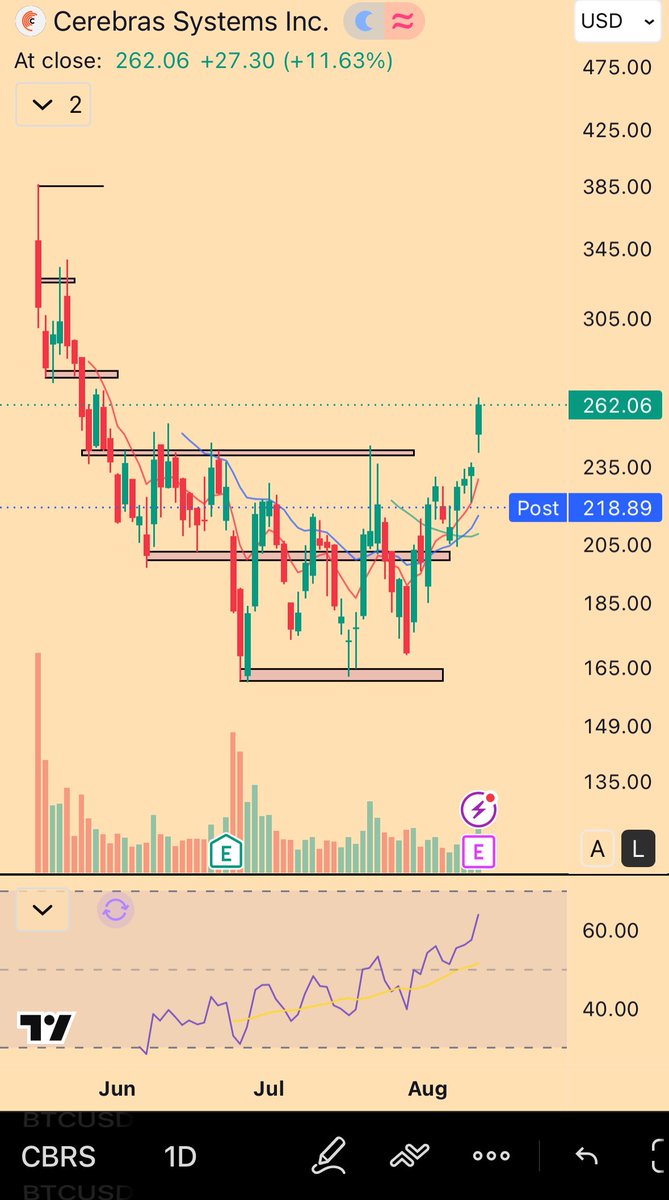
$CBRS — "Earnings were bad, but chart says take a chance"
CBRS chart — bad earnings, but the chart says take a chance
The classic Mandelbrot tension: fundamentals said sell, the chart said buy. He posts the two-chart setup and picks the chart — "Earnings were bad, but chart says take a chance" — a pure technical long into weakness.
His Book & Positions
SPCX: fully out by 149.50 after +40% in five trading days (over 50% TP'd earlier in the session), rebuying only on a clean break of 150. Vol: SPX and IWM vol "low enough to start buying" — leaning into the tail-hedge. CCJ: on the wrong side of the weekly-trend test — partials and watch the reaction. Crypto: out of longs; will re-test the old-range POC into the next round of unlocks — "buy first unlocks, sell the second."
Macro & Markets
Semis are the week's decision point — SOXX/SOXL into Friday, with NVDA dominance the bear case. QQQ so far refuses to confirm ('So far the answer is no'). The tape is too quiet into the setup — he expects vol soon. Rotation watch: 'They are selling their Tesla for SpaceX.'